Skeletal abnormalities in mice lacking extracellular matrix proteins, thrombospondin-1, thrombospondin-3, thrombospondin-5, and type IX collagen
- PMID: 18467703
- PMCID: PMC2408425
- DOI: 10.2353/ajpath.2008.071094
Skeletal abnormalities in mice lacking extracellular matrix proteins, thrombospondin-1, thrombospondin-3, thrombospondin-5, and type IX collagen
Abstract
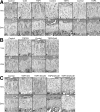
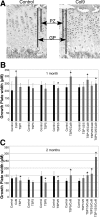
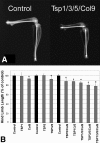
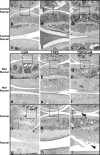
Thrombospondin-5 (TSP5) is a large extracellular matrix glycoprotein found in musculoskeletal tissues. TSP5 mutations cause two skeletal dysplasias, pseudoachondroplasia and multiple epiphyseal dysplasia; both show a characteristic growth plate phenotype with retention of TSP5, type IX collagen (Col9), and matrillin-3 in the rough endoplasmic reticulum. Whereas most studies focus on defining the disease process, few functional studies have been performed. TSP5 knockout mice have no obvious skeletal abnormalities, suggesting that TSP5 is not essential in the growth plate and/or that other TSPs may compensate. In contrast, Col9 knockout mice have diminished matrillin-3 levels in the extracellular matrix and early-onset osteoarthritis. To define the roles of TSP1, TSP3, TSP5, and Col9 in the growth plate, all knockout and combinatorial strains were analyzed using histomorphometric techniques. While significant alterations in growth plate organization were found in certain single knockout mouse strains, skeletal growth was only mildly disturbed. In contrast, dramatic changes in growth plate organization in TSP3/5/Col9 knockout mice resulted in a 20% reduction in limb length, corresponding to similar short stature in humans. These studies show that type IX collagen may regulate growth plate width; TSP3, TSP5, and Col9 appear to contribute to growth plate organization; and TSP1 may help define the timing of growth plate closure when other extracellular proteins are absent.
Figures


Similar articles
-
Genetic mouse models for the functional analysis of the perifibrillar components collagen IX, COMP and matrilin-3: Implications for growth cartilage differentiation and endochondral ossification.Histol Histopathol. 2009 Aug;24(8):1067-79. doi: 10.14670/HH-24.1067. Histol Histopathol. 2009. PMID: 19554514 Review.
-
Comparative proteomic analysis of normal and collagen IX null mouse cartilage reveals altered extracellular matrix composition and novel components of the collagen IX interactome.J Biol Chem. 2013 May 10;288(19):13481-92. doi: 10.1074/jbc.M112.444810. Epub 2013 Mar 24. J Biol Chem. 2013. PMID: 23530037 Free PMC article.
-
Ablation of collagen IX and COMP disrupts epiphyseal cartilage architecture.Matrix Biol. 2008 May;27(4):306-18. doi: 10.1016/j.matbio.2007.11.007. Epub 2007 Dec 3. Matrix Biol. 2008. PMID: 18191556
-
An inducible cartilage oligomeric matrix protein mouse model recapitulates human pseudoachondroplasia phenotype.Am J Pathol. 2009 Oct;175(4):1555-63. doi: 10.2353/ajpath.2009.090184. Epub 2009 Sep 17. Am J Pathol. 2009. PMID: 19762713 Free PMC article.
-
The role of cartilage oligomeric matrix protein (COMP) in skeletal disease.Curr Drug Targets. 2008 Oct;9(10):869-77. doi: 10.2174/138945008785909293. Curr Drug Targets. 2008. PMID: 18855621 Review.
Cited by
-
Insights into shell deposition in the Antarctic bivalve Laternula elliptica: gene discovery in the mantle transcriptome using 454 pyrosequencing.BMC Genomics. 2010 Jun 8;11:362. doi: 10.1186/1471-2164-11-362. BMC Genomics. 2010. PMID: 20529341 Free PMC article.
-
Thrombospondin-2 and SPARC/osteonectin are critical regulators of bone remodeling.J Cell Commun Signal. 2009 Dec;3(3-4):227-38. doi: 10.1007/s12079-009-0076-0. Epub 2009 Oct 28. J Cell Commun Signal. 2009. PMID: 19862642 Free PMC article.
-
Thrombospondin-3 augments injury-induced cardiomyopathy by intracellular integrin inhibition and sarcolemmal instability.Nat Commun. 2019 Jan 8;10(1):76. doi: 10.1038/s41467-018-08026-8. Nat Commun. 2019. PMID: 30622267 Free PMC article.
-
Novel regulators of Fgf23 expression and mineralization in Hyp bone.Mol Endocrinol. 2009 Sep;23(9):1505-18. doi: 10.1210/me.2009-0085. Epub 2009 Jun 25. Mol Endocrinol. 2009. PMID: 19556340 Free PMC article.
-
The Role of Thrombospondins in Osteoarthritis: from Molecular Mechanisms to Therapeutic Potential.Int J Biol Sci. 2025 Mar 3;21(5):2346-2359. doi: 10.7150/ijbs.103343. eCollection 2025. Int J Biol Sci. 2025. PMID: 40083685 Free PMC article. Review.
References
-
- Adams J, Tucker RP, Lawler J. New York: Springer-Verlag,; The thrombospondin gene family. 1995
-
- Délot E, Brodie SG, King LM, Wilcox WR, Cohn DH. Physiological and pathological secretion of cartilage oligomeric matrix protein by cells in culture. J Biol Chem. 1998;273:26692–26697. - PubMed
-
- Fang C, Johnson D, Leslie MP, Carlson CS, Robbins M, Di Cesare PE. Tissue distribution and measurement of cartilage oligomeric matrix protein in patients with magnetic resonance imaging-detected bone bruises after acute anterior cruciate ligament tears. J Orthop Res. 2001;19:634–641. - PubMed
Publication types
MeSH terms
Substances
Grants and funding
LinkOut - more resources
Full Text Sources
Molecular Biology Databases
Miscellaneous

