. 2008 May;28(5):687-97.
doi: 10.1016/j.immuni.2008.03.016. Epub 2008 May 8.

Central role of defective interleukin-2 production in the triggering of islet autoimmune destruction

Affiliations

Central role of defective interleukin-2 production in the triggering of islet autoimmune destruction

Qizhi Tang et al. Immunity. 2008 May.

Abstract

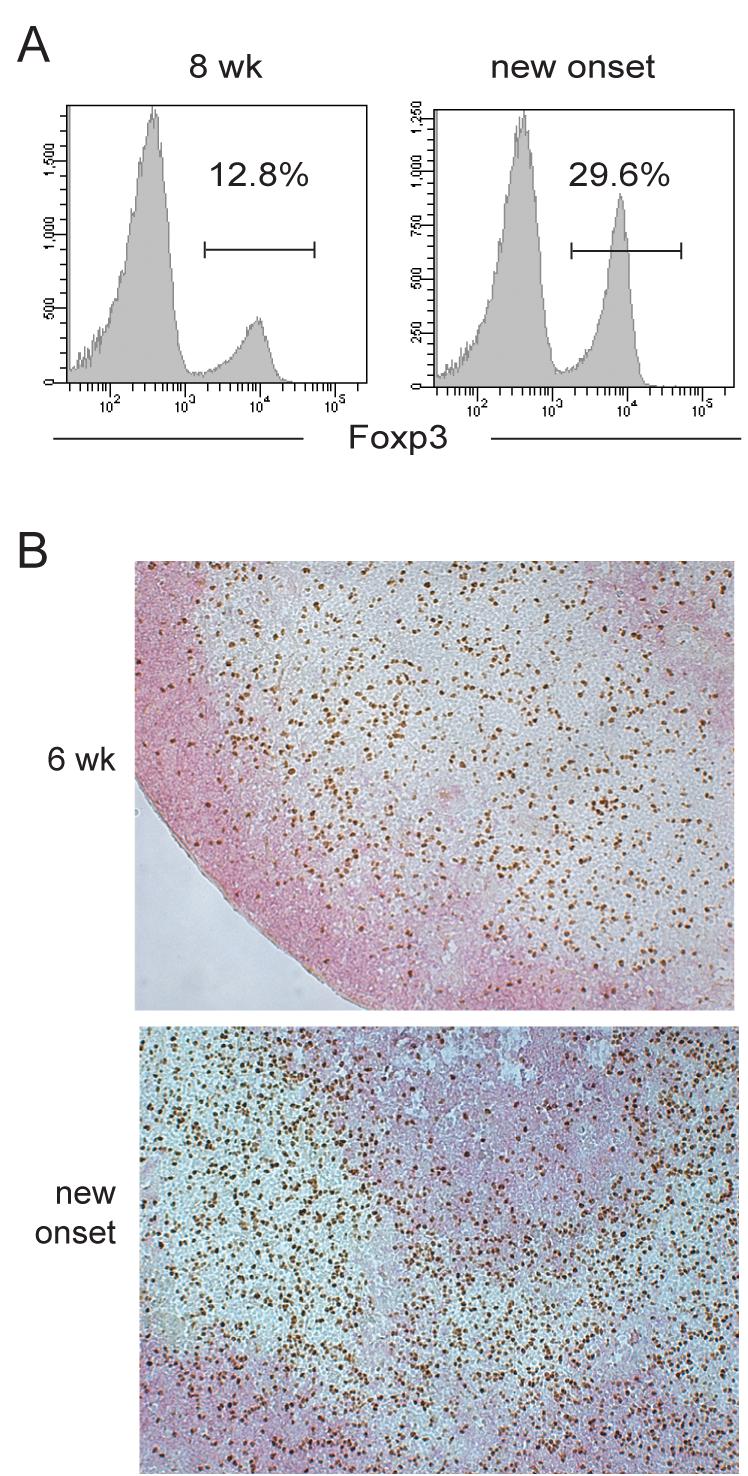
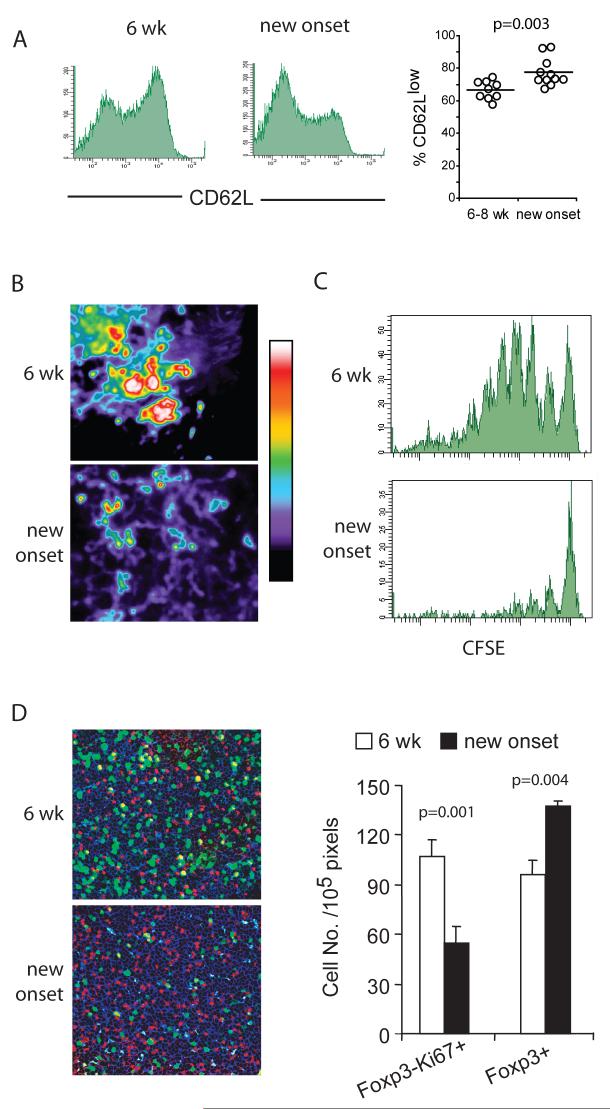
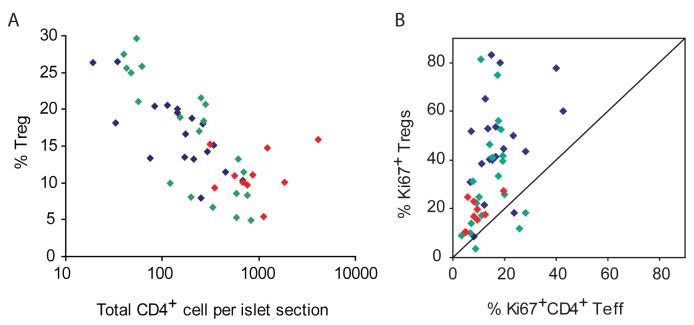
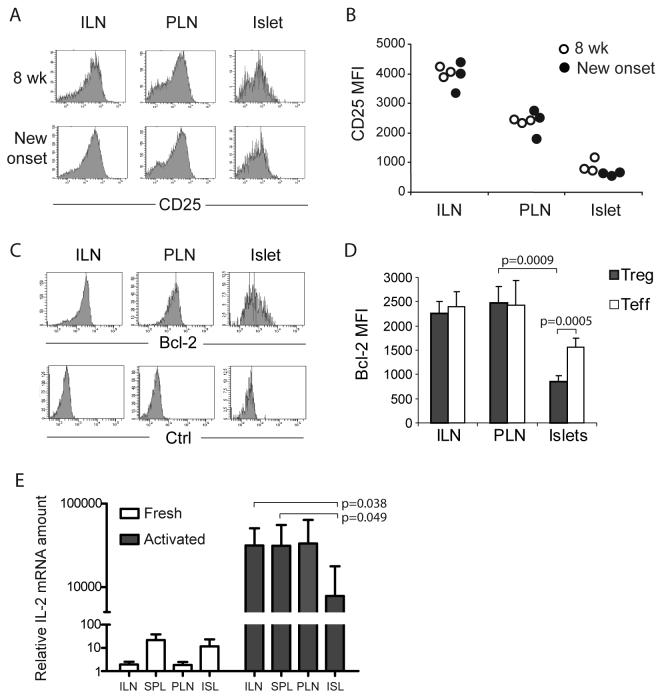
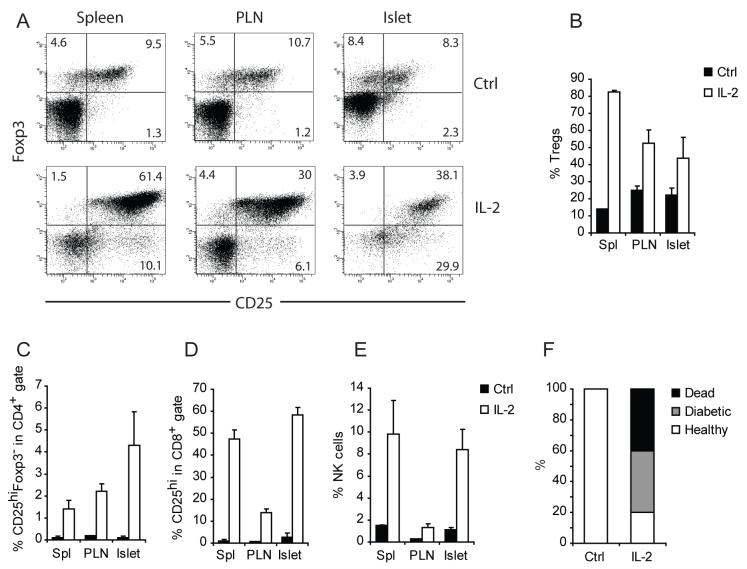
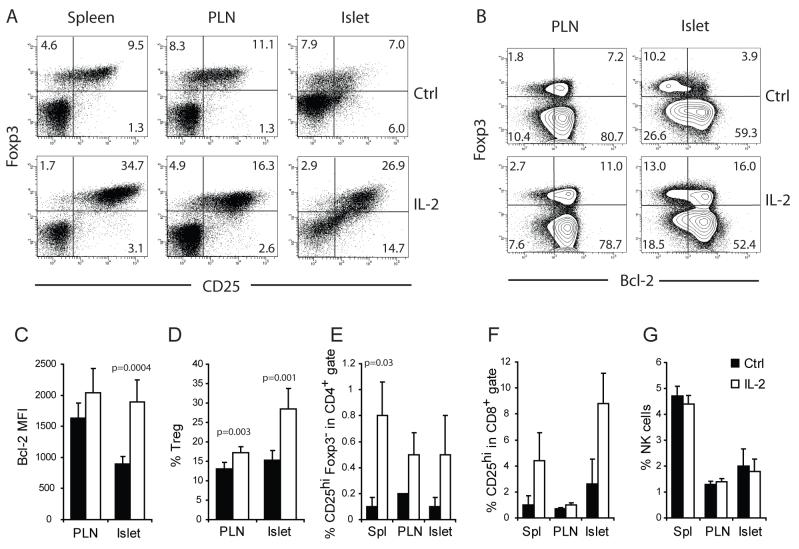
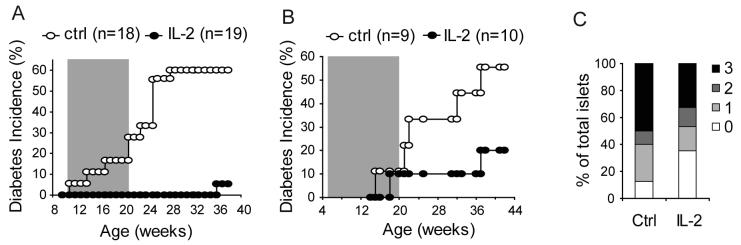
The dynamics of CD4(+) effector T cells (Teff cells) and CD4(+)Foxp3(+) regulatory T cells (Treg cells) during diabetes progression in nonobese diabetic mice was investigated to determine whether an imbalance of Treg cells and Teff cells contributes to the development of type 1 diabetes. Our results demonstrated a progressive decrease in the Treg cell:Teff cell ratio in inflamed islets but not in pancreatic lymph nodes. Intra-islet Treg cells expressed reduced amounts of CD25 and Bcl-2, suggesting that their decline was due to increased apoptosis. Additionally, administration of low-dose interleukin-2 (IL-2) promoted Treg cell survival and protected mice from developing diabetes. Together, these results suggest intra-islet Treg cell dysfunction secondary to defective IL-2 production is a root cause of the progressive breakdown of self-tolerance and the development of diabetes in nonobese diabetic mice.


Figures

Figure 1
Figure 1. Preserved Treg:Teff balance in PLN during T1D progression
(A.) Flow-cytometric analysis of the percentage of Foxp3+ cells in the total CD4+ T cell population of the PLN of NOD mice. Representative histograms from an 8 week old prediabetic and a new-onset diabetic NOD are shown. (B.) Immunohistochemistry of Foxp3 (brown) and B200 (pink) expression in the PLN of 6-week old and new onset diabetic NOD mice. Data represents five independent experiments with total of 10-12 mice from each disease group.
Figure 2
Figure 2. Preservation of Treg cell functions and reduced Teff cell priming in the PLN at the time of disease onset
(A.) Flow cytometric analysis of CD62L expression on CD4+ Foxp3+ cells in the PLN of 6-week old and new-onset diabetic NOD mice. The graph on the right is a summary of four independent experiments comparing CD62L expression on CD4+CD25+ cells in pancreatic LN of young prediabetic (n=9) and newly diabetic (n=11) female NOD mice. (B.) CD4+CD62L+CD25- cells from BDC2.5 T cell receptor transgenic mice were purified by FACS, labeled with CFSE and transferred to 6-week old NOD mice and to mice within three days of diabetes onset. The movement dynamics of transferred Treg cells in explanted PLN were monitored using two-photon laser scanning microscopy. The normalized average CFSE fluorescent intensity over a 30-minute imaging period is illustrated in the “heat maps” shown. The large aggregates of strong fluorescent intensity represented by the yellow-red-white colors indicates restricted movement of cell clusters due to antigen recognition and the lower intensity represented by the blue-purple-black colors indicates random movement in the absence of antigen recognition. (C.) In Vivo Proliferation of transferred CD4+CD62L+CD25- cells from a BDC2.5 T cell receptor transgenic mice in PLN of 6-week old or new-onset diabetic mice were determined by CFSE dilution assay. Two representative histograms are shown. (D.) Proliferation of endogenous T cells in the PLN of 6-week-old and new-onset diabetic NOD mice was determined by co-staining PLN sections for the mitotic marker Ki67 (green), anti-CD4 (blue), and anti-Foxp3 (red). Representative micrographs are shown (left) and the average numbers of Foxp3+ cells and Foxp3- Ki67+ cells in three randomly selected objective fields in the T cell zones of the PLN are summarized (right, mean±sd, n=3 mice). Results in each panel represent two to four independent experiments.
Figure 3
Figure 3. Dynamics of Teff and Treg cells in the islets of NOD mice during diabetes progression
(A.) Numbers of CD4+ and Foxp3+ cells in individual islets were quantified by manual counting of frozen pancreatic sections strained with immunofluorescent labled antibodies. The percentages of Foxp3+ Treg cells among CD4+ T cells in individual islet sections are plotted against the total numbers of CD4+ cells in the corresponding islet sections. Correlation analysis revealed a significant inverse correlation (Spearman r = - 0.707) between the numbers of total CD4+ T cells per islet section and percentage of Treg cells in the corresponding islet (p<0.0001). (B.) Numbers of Ki67+CD4+Foxp3-, Ki67-CD4+Foxp3-, Ki67+CD4+Foxp3+, and Ki67-CD4+Foxp3+ cells in individual islets were quantified as described in A. Percentages of proliferating (Ki67+) Treg cells vs. proliferating Teff cells in islets were calculated and plotted. For both panels, blue symbols represent islets from 6-8 week old NOD mice, green symbols are from 10-12 week old mice and red symbols are from mice with recent diabetes onset.
Figure 4
Figure 4. Loss of CD25 and Bcl-2 expression on intra-islet Treg cells
(A and B.) Flow cytometric analyses of CD25 expression on CD4+Foxp3+ cells. Representative CD25 versus Foxp3 dot plots of CD4+ cells in ILN, PLN and islets and are shown (A) along with a graph summarizing the the mean fluorescent intensities of CD25 on CD4+Foxp3+ cells (B). The open symbols represent 8 week old mice and filled symbols represent mice with recent diabetes onset. Results are representative of four independent experiments. (C and D.) Flow cytometric analysis of Bcl-2 expression in CD4+Foxp3+ cells. Representative Bcl-2 (top) and isotype control staining (bottom) histograms of CD4+Foxp3+ cells in ILN, PLN, and islets are shown (C) along with a bar graph summarizing the mean fluorescent intensities of Bcl-2 expression in CD4+Foxp3+ cells (D, mean±sd, n=4). Results are representative of five independent experiments. (E.) real-time RT-PCR analysis of IL-2 mRNA in various lymphoid organs and islets. Tissue samples from prediabetic NOD female mice were assayed individually (mean±sd, n=4). Student t test was performed to determine the statistical significance of the difference and p values for the significantly different sample pairs are shown on the graph.
Figure 5
Figure 5. Effect of high dose IL-2 treatment on prediabetic NOD mice
A cohort of 10-week old female NOD mice were treated with daily intra-peritoneal injections of 5 μg IL-2 and 50 μg of anti-IL-2 complex or irrelevant rat IgG as control for five consecutive days (n=3/condition). One week after the initiation of the treatment, the composition of the spleen, PLN and intra-islet infiltrates were analyzed by flow cytometry. (A.) Dot plots displaying Foxp3 and CD25 expression on CD4+ cells in control- (Top) and IL-2 complex-(bottom) treated mice. (B) Bar graphs summarizing the frequency of Treg cells and (C) CD25hiFoxp3- Teff cells among CD4+ cells, (D) CD25hi cells among CD8+ cells and (E) percentage of NK cells among all CD45+ leukocytes are shown (mean±sd, n=3). The differences between control and IL-2 treated samples in panels B through E in all organs analyzed are significant (p<0.05) by student t test analysis. Results are representative of three independent experiments. (F.) A separate cohort of 10-week old female NOD mice were treated with control rat IgG or IL-2 complex as in A (n=10/group). The outcome one week after the treatment is summarized. Result represents three separate experiments.
Figure 6
Figure 6. Low dose IL-2 therapy restores Treg:Teff balance
A cohort of ten week-old female NOD mice were treated with daily injections of 0.5 μg IL-2 and 5 μg anti-IL-2 complex or irrelevant rat IgG as control for five consecutive days. Expression of (A) CD25 and (B and C) Bcl-2 on Treg cells in PLN and islets were determined by flow cytometry. Percentages of (D) Treg cells, (E) Foxp-CD25hi CD4+ Teff cells, (F) CD25hi CD8+ Teff cells, and (G) NK cells are summarized (mean±sd, n=5 for panel C, D, and G; n=3 for panels E and F). P-values for the samples that showed significant differences between control and IL-2 treated mice are indicated in the graphs, and all others were not significantly different by student t test (p>0.05). Results are representative of at least three independent experiments.
Figure 7
Figure 7. Low dose IL-2 therapy prevents diabetes
Diabetes progression in NOD mice treated with (A) 0.5 μg IL-2 and 5 μg anti-IL-2 complex or (B) recombinant human IL-2. Control mice received saline. Shaded areas inside the graphs indicate the duration of the treatments, between 10-20 weeks for A and between 5 and 20 for B. P-values between the control and the IL-2-treated groups are 0.0002 for experiment depicted in A and 0.11 for experiment in B. (C.) Severity of intra-islet infiltration in mice that remain free of overt diabetes at the end of the experiment in B was evaluated histologically and the percentage of islets with no infiltration (0), peri-insulitis (1), moderate insulitis with less than 50% islet area infiltrated (2), and severe insulitis with greater than 50% islet area infiltrated (3) were determined and plotted. Data for the Saline group represents 40 islets from 4 mice and data from IL-2 treatment group represents 341 islets from 8 mice.

Comment in

  • Regulating Treg cells at sites of inflammation.
    Lazarski CA, Hughson A, Sojka DK, Fowell DJ. Lazarski CA, et al. Immunity. 2008 Oct 17;29(4):511; author reply 512. doi: 10.1016/j.immuni.2008.09.012. Immunity. 2008. PMID: 18957259 No abstract available.

References

    1. Aluvihare VR, Betz AG. The role of regulatory T cells in alloantigen tolerance. Immunol Rev. 2006;212:330–343. - PubMed
    1. Anderson MS, Bluestone JA. The NOD mouse: a model of immune dysregulation. Annu Rev Immunol. 2005;23:447–485. - PubMed
    1. Arkwright PD, Abinun M, Cant AJ. Autoimmunity in human primary immunodeficiency diseases. Blood. 2002;99:2694–2702. - PubMed
    1. Belkaid Y, Blank RB, Suffia I. Natural regulatory T cells and parasites: a common quest for host homeostasis. Immunol Rev. 2006;212:287–300. - PubMed
    1. Belkaid Y, Piccirillo CA, Mendez S, Shevach EM, Sacks DL. CD4+CD25+ regulatory T cells control Leishmania major persistence and immunity. Nature. 2002;420:502–507. - PubMed

Publication types

MeSH terms

Substances