. 2008 Jul 5;376(2):357-70.
doi: 10.1016/j.virol.2008.03.032. Epub 2008 May 12.

Inhibition of alphavirus infection in cell culture and in mice with antisense morpholino oligomers

Affiliations

Inhibition of alphavirus infection in cell culture and in mice with antisense morpholino oligomers

Slobodan Paessler et al. Virology. .

Abstract

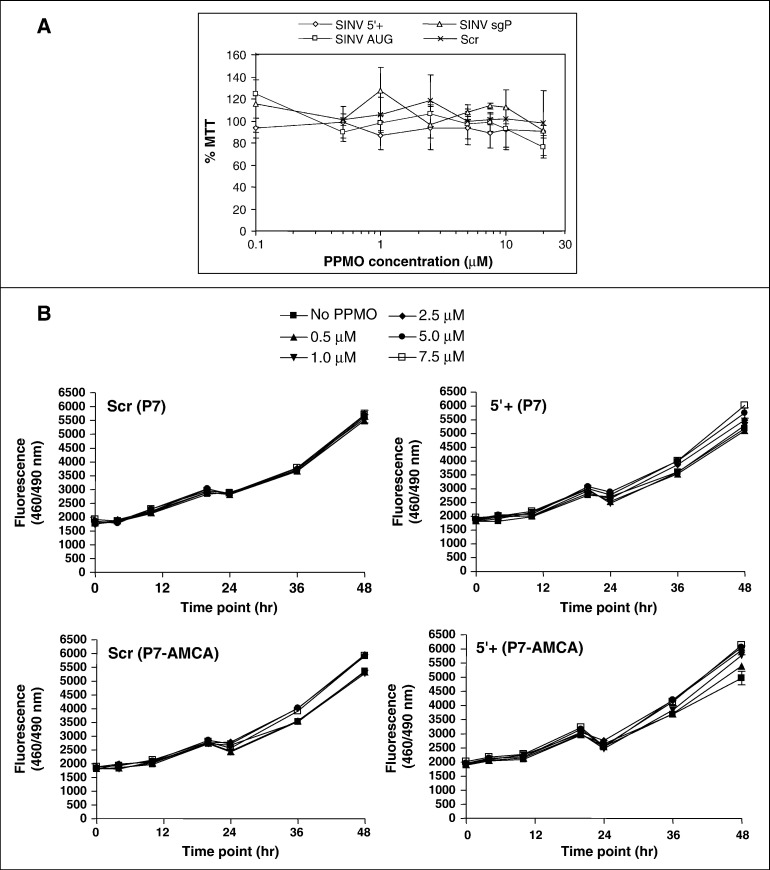
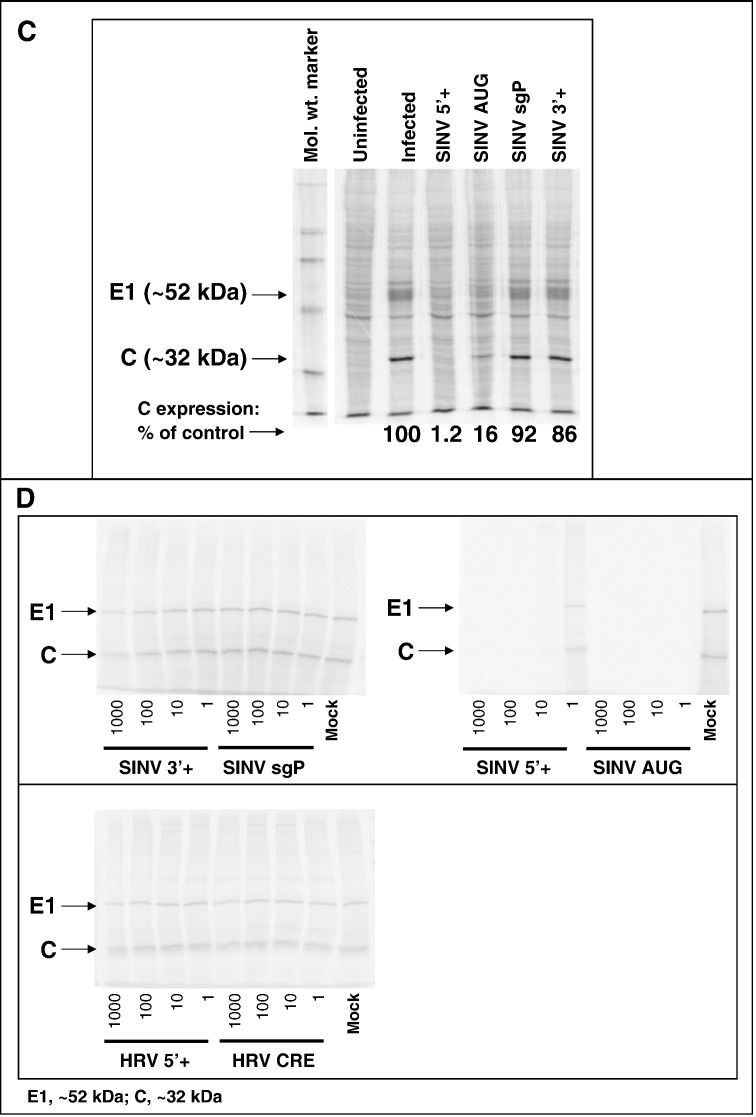
The genus Alphavirus contains members that threaten human health, both as natural pathogens and as potential biological weapons. Peptide-conjugated phosphorodiamidate morpholino oligomers (PPMO) enter cells readily and can inhibit viral replication through sequence-specific steric blockade of viral RNA. Sindbis virus (SINV) has low pathogenicity in humans and is regularly utilized as a model alphavirus. PPMO targeting the 5'-terminal and AUG translation start site regions of the SINV genome blocked the production of infectious SINV in tissue culture. PPMO designed against corresponding regions in Venezuelan equine encephalitis virus (VEEV) were likewise found to be effective in vitro against several strains of VEEV. Mice treated with PPMO before and after VEEV infection were completely protected from lethal outcome while mice receiving only post-infection PPMO treatment were partially protected. Levels of virus in tissue samples correlated with animal survival. Uninfected mice suffered no apparent ill-effects from PPMO treatment. Thus, PPMO appear promising as candidates for therapeutic development against alphaviruses.


Figures

Fig. 1
Fig. 1
Location of PPMO target sites in alphavirus genome segments. A schematic representation of the alphavirus genome is shown. PPMO were designed to target the terminal 5′ and 3′ untranslated regulatory regions (UTR) of alphavirus genomic (+) and antigenomic (−) RNA (labeled A–D), as well as the AUG translation start site region of the genomic (labeled E), and subgenomic promoter region of the antigenomic (labeled F), RNA. Sindbis virus (SINV)- and Venezuelan equine encephalitis virus (VEEV)-specific PPMO name designations and sequences are shown in Table 1.
Fig. 2
Fig. 2
Effect of PPMO on cell viability. A) SINV PPMO. BHK cells were incubated with the 0.1, 0.5, 1, 2.5, 5, 7.5, 10, or 20 μM of the indicated with the P3-conjugated SINV-specific PPMO (SINV 5′+, SINV AUG, or SINV sgP, see Table 1), or as a negative control, the P3-conjugated Scr PPMO (a random nucleotide sequence), for 24 h. Reduction of cell viability, measured by MTT assay (described in Materials and methods), is expressed relative to mock-treated cells. B) VEEV PPMO. Vero cells were incubated with the P7- or P7-AMCA-conjugated VEEV 5′+ PPMO (see Table 1), or as a negative control, the P7- or P7-AMCA-conjugated Scr PPMO (a random nucleotide sequence) with a range of PPMO concentrations (0.1, 0.5, 1, 2.5, 5 and 7.5 μm) and for different time points (0, 4, 10, 20, 24, 36, 48 h). The average of quadruplicate treatments, measured by CellTiter-Blue® assay (described in Materials and methods), is shown. Two-way ANOVA (α = 0.05) with Bonferroni post-test for pairwise comparison of PPMO-treated vs. untreated (“No PPMO”) controls by respective time point and concentration was performed.
Fig. 3
Fig. 3
PPMO antiviral activity against the alphavirus, SINV. A) Dose–response inhibition of recombinant SINV production. A) Dose–response inhibition of recombinant SINV production. BHK cells were infected with SinLuc at a multiplicity of infection (moi) of ∼ 0.03, followed by treatment with the indicated concentrations of SINV AUG, SINV sgP or Scr PPMO (left) or SINV genomic termini targeting PPMO (right) for 24 h. Luciferase (Luc) levels were measured in triplicate, as described in Materials and methods. The average and standard deviation are shown. Statistical analysis of luciferase levels of SINV PPMO vs. Scr treatment (two-way ANOVA, α = 0.05; pairwise comparison via Bonferroni post-test) was performed and results are described in the text. B) Dose–response inhibition of wild type SINV. Panel i–ii) Effect of SINV PPMO on SINV production. BHK cells were infected with SINV at an moi of ∼ 0.03 and treated at 1 hpi with the indicated PPMO (1 or 5 μM, panels i and ii, respectively). At 24 hpi, the virus levels in supernatant samples were determined by plaque assay. Supernatants were analyzed in quadruplicate (1 μM) or triplicate (5 μM). The results of one representative experiment out of two performed is shown. Statistical analysis was performed using one-way ANOVA (α = 0.05) with Dunnett's Multiple Comparison Test in pairwise comparison of each PPMO-treated group relative to the mock control. Statistically significant differences in Dunnett's test are indicated by an asterisk (⁎p-value < 0.01) and the percent reduction is shown to the left. Panel iii) Effect of SINV PPMO on two control viruses, VSV and TC83. Vero cells were infected with VSV or VEEV (TC83) at an moi of 0.1 and treated at 1 hpi with the indicated PPMO at 5 μM. At 8 and 24 h, the virus production levels were determined by plaque assay. Viral titration of untreated, infected Vero cells (“No PPMO”) was also performed. The result of a single experiment is shown. C) Inhibition of viral protein expression by SINV-specific PPMO. BHK cells were treated with the indicated PPMO starting at 1 h after infection with SINV (moi of 0.03). At 24 hpi the cells were incubated with 35S-methionine for 1 h, and cell lysates then analyzed by SDS-PAGE. The molecular weight marker is shown. Viral capsid (C) and envelope protein (E1) and apparent molecular mass are indicated by the arrows. The percentage of C expression, relative to the mock-treated control, as determined by densitometry, is shown numerically under the lanes. D) Inhibition of viral translation by SINV-specific PPMO. In vitro transcribed SINV RNA was translated in rabbit reticulocyte lysates in the presence of a molar excess of the indicated PPMO as described in Materials and methods. Samples were separated by SDS-PAGE and visualized by phosphor imager.
Fig. 3
Fig. 3
PPMO antiviral activity against the alphavirus, SINV. A) Dose–response inhibition of recombinant SINV production. A) Dose–response inhibition of recombinant SINV production. BHK cells were infected with SinLuc at a multiplicity of infection (moi) of ∼ 0.03, followed by treatment with the indicated concentrations of SINV AUG, SINV sgP or Scr PPMO (left) or SINV genomic termini targeting PPMO (right) for 24 h. Luciferase (Luc) levels were measured in triplicate, as described in Materials and methods. The average and standard deviation are shown. Statistical analysis of luciferase levels of SINV PPMO vs. Scr treatment (two-way ANOVA, α = 0.05; pairwise comparison via Bonferroni post-test) was performed and results are described in the text. B) Dose–response inhibition of wild type SINV. Panel i–ii) Effect of SINV PPMO on SINV production. BHK cells were infected with SINV at an moi of ∼ 0.03 and treated at 1 hpi with the indicated PPMO (1 or 5 μM, panels i and ii, respectively). At 24 hpi, the virus levels in supernatant samples were determined by plaque assay. Supernatants were analyzed in quadruplicate (1 μM) or triplicate (5 μM). The results of one representative experiment out of two performed is shown. Statistical analysis was performed using one-way ANOVA (α = 0.05) with Dunnett's Multiple Comparison Test in pairwise comparison of each PPMO-treated group relative to the mock control. Statistically significant differences in Dunnett's test are indicated by an asterisk (⁎p-value < 0.01) and the percent reduction is shown to the left. Panel iii) Effect of SINV PPMO on two control viruses, VSV and TC83. Vero cells were infected with VSV or VEEV (TC83) at an moi of 0.1 and treated at 1 hpi with the indicated PPMO at 5 μM. At 8 and 24 h, the virus production levels were determined by plaque assay. Viral titration of untreated, infected Vero cells (“No PPMO”) was also performed. The result of a single experiment is shown. C) Inhibition of viral protein expression by SINV-specific PPMO. BHK cells were treated with the indicated PPMO starting at 1 h after infection with SINV (moi of 0.03). At 24 hpi the cells were incubated with 35S-methionine for 1 h, and cell lysates then analyzed by SDS-PAGE. The molecular weight marker is shown. Viral capsid (C) and envelope protein (E1) and apparent molecular mass are indicated by the arrows. The percentage of C expression, relative to the mock-treated control, as determined by densitometry, is shown numerically under the lanes. D) Inhibition of viral translation by SINV-specific PPMO. In vitro transcribed SINV RNA was translated in rabbit reticulocyte lysates in the presence of a molar excess of the indicated PPMO as described in Materials and methods. Samples were separated by SDS-PAGE and visualized by phosphor imager.
Fig. 4
Fig. 4
PPMO antiviral activity against pathogenic alphaviruses. A) PPMO inhibition of multiple VEEV strains. Vero cells were infected at a moi of 0.1 with the indicated strain of VEEV (TC-83, SH3, ZPC738, or 68U201) or, as a negative control, with vesicular stomatitis virus (VSV) for 2 h prior to the addition of the indicated PPMO at 5 μM. At 8 (left) or 24 hpi (right), supernatants were harvested for analysis of viral titer via plaque assay. The VEEV serotype is indicated in parentheses. SH3 and TC-83 are epizootic (or epizootic derivative) strains; 68U201 and ZPC738 are enzootic strains. The horizontal line depicts the limit of detection. Asterisk (⁎) indicates that no virus was detected for any sample in that group. The result of a single experiment is shown. B) PPMO dose–response inhibition of VEEV. Vero cells were infected at a moi of 0.1 with VEEV (TC-83 strain) for 1 h prior to the addition of the indicated AMCA-conjugated PPMO at doses in the range of 0.5 to 7.5 μM. At various time points post-infection (indicated in graph), supernatants were harvested for analysis of viral titer via plaque assay. The result of a single experiment is shown. C) Effect of VEEV PPMO on VEEV and on the control virus, VSV (eight replicates). Vero cells were infected at a moi of 0.1 with VEEV (TC-83 strain), or as a control, with VSV, for 1 h prior to the addition of the indicated P7-AMCA-conjugated PPMO at 5 μM. Supernatants were harvested at 8 and 24 hpi for analysis of viral titer via plaque assay, performed in eight replicates at each time point for VEEV or VSV. Statistical analysis was performed on log10-transformed viral titer values comparing all treatments using one-way analysis of variance (α = 0.05, GraphPad Prism). Pairwise comparison of the log10-titer values by treatment group was performed using Bonferroni post-test. Bars with asterisk indicate a statistically significant difference (Bonferroni, p-value < 0.001). The average percent change was calculated from log10 titers as: 100 ⁎ (VEEV PPMO-average control) ÷ average control. A summary table showing the average percent change, relative to either the untreated (“No PPMO”) or Scr controls is shown. D) Effect of combined VEEV 5′+ and VEEV AUG PPMO on VEEV. Vero cells were infected at a moi of 0.1 with VEEV (TC-83 strain), or as a control, with VSV, for 1 h prior to the addition of the indicated P7-AMCA-conjugated PPMO at 7.5 and 10 μM (each PPMO). Supernatants were harvested at 8 and 24 hpi (and for VSV, at 8, 24, and 48 hpi) for analysis of viral titer via plaque assay. The result of a single experiment is shown.
Fig. 4
Fig. 4
PPMO antiviral activity against pathogenic alphaviruses. A) PPMO inhibition of multiple VEEV strains. Vero cells were infected at a moi of 0.1 with the indicated strain of VEEV (TC-83, SH3, ZPC738, or 68U201) or, as a negative control, with vesicular stomatitis virus (VSV) for 2 h prior to the addition of the indicated PPMO at 5 μM. At 8 (left) or 24 hpi (right), supernatants were harvested for analysis of viral titer via plaque assay. The VEEV serotype is indicated in parentheses. SH3 and TC-83 are epizootic (or epizootic derivative) strains; 68U201 and ZPC738 are enzootic strains. The horizontal line depicts the limit of detection. Asterisk (⁎) indicates that no virus was detected for any sample in that group. The result of a single experiment is shown. B) PPMO dose–response inhibition of VEEV. Vero cells were infected at a moi of 0.1 with VEEV (TC-83 strain) for 1 h prior to the addition of the indicated AMCA-conjugated PPMO at doses in the range of 0.5 to 7.5 μM. At various time points post-infection (indicated in graph), supernatants were harvested for analysis of viral titer via plaque assay. The result of a single experiment is shown. C) Effect of VEEV PPMO on VEEV and on the control virus, VSV (eight replicates). Vero cells were infected at a moi of 0.1 with VEEV (TC-83 strain), or as a control, with VSV, for 1 h prior to the addition of the indicated P7-AMCA-conjugated PPMO at 5 μM. Supernatants were harvested at 8 and 24 hpi for analysis of viral titer via plaque assay, performed in eight replicates at each time point for VEEV or VSV. Statistical analysis was performed on log10-transformed viral titer values comparing all treatments using one-way analysis of variance (α = 0.05, GraphPad Prism). Pairwise comparison of the log10-titer values by treatment group was performed using Bonferroni post-test. Bars with asterisk indicate a statistically significant difference (Bonferroni, p-value < 0.001). The average percent change was calculated from log10 titers as: 100 ⁎ (VEEV PPMO-average control) ÷ average control. A summary table showing the average percent change, relative to either the untreated (“No PPMO”) or Scr controls is shown. D) Effect of combined VEEV 5′+ and VEEV AUG PPMO on VEEV. Vero cells were infected at a moi of 0.1 with VEEV (TC-83 strain), or as a control, with VSV, for 1 h prior to the addition of the indicated P7-AMCA-conjugated PPMO at 7.5 and 10 μM (each PPMO). Supernatants were harvested at 8 and 24 hpi (and for VSV, at 8, 24, and 48 hpi) for analysis of viral titer via plaque assay. The result of a single experiment is shown.
Fig. 5
Fig. 5
Antiviral efficacy of PPMO treatment against VEEV in mice. A) Survival of PPMO-treated mice. Nine-week-old NIH Swiss mice were treated with VEEV-specific P7-PPMO (combined VEEV AUG and VEEV 5′+) or the control Scr P7-PPMO at a dose of 40 μg via intranasal (i.n.) route and 160 μg via subcutaneous (s.c.) route at time points pre- (2 doses: − 24 h and − 4 h, indicated as “+pre”) and/or post-infection (5 doses: daily on day +1 through +5, indicated as “+post”). Treatment groups are indicated in the figure legend, as follows: 1) AUG and 5′+ (+pre, +post)/no VEEV: VEEV-specific PPMO at time points prior to (+pre) and following (+post) infection; graph symbol ○, 2) No PPMO/+VEEV: no treatment of VEEV-infected mice; graph symbol +, 3) Scr (+pre, +post)/+VEEV: Scr treatment at pre- and post-infection time points; graph symbol ♦, 4) AUG and 5′+ (+pre, +post)/+VEEV: VEEV-specific PPMO at pre- and post-infection time points; graph symbol ▲, 5) AUG and 5′+ (−pre, +post)/+VEEV: VEEV-specific PPMO at post-infection time points only; graph symbol Δ. On day 0, mice were infected via i.n. route with virulent VEEV (ZPC738) at a dose of 103 PFU per animal (groups 2–6). As a control for P7-PPMO toxicity, group 1 was treated with VEEV-specific P7-PPMO in an identical manner as group 4, but was not infected with VEEV. Mice were observed daily and deaths recorded over a 28-day period following infection. B) Infectious virus levels in the tissues of no PPMO or VEEV-specific PPMO-treated mice. Randomly pre-selected mice (N = 5 per group) from groups receiving no PPMO treatment (group 2) or VEEV-specific PPMO treatment (groups 4 and 5), described for panel A, were euthanized at 2, 3 and 4 days post-infection (dpi) for harvest of blood, brain and peripheral organs (liver, spleen and lung). Infectious virus levels were determined via plaque assay. The horizontal line depicts the limit of detection. Asterisk (⁎) indicates that no virus was detected for any organ sample tested in the respective group.

References

    1. Abes S., Moulton H.M., Clair P., Prevot P., Youngblood D.S., Wu R.P., Iversen P.L., Lebleu B. Vectorization of morpholino oligomers by the (R-Ahx-R)(4) peptide allows efficient splicing correction in the absence of endosomolytic agents. J. Control. Release. 2006;116(3):304–313. - PubMed
    1. Anishchenko M., Bowen R.A., Paessler S., Austgen L., Greene I.P., Weaver S.C. Venezuelan encephalitis emergence mediated by a phylogenetically predicted viral mutation. Proc. Natl. Acad. Sci. U. S. A. 2006;103(13):4994–4999. - PMC - PubMed
    1. Berge T.O., Banks I.S., Tigertt W.D. Attenuation of Venezuelan equine encephalomyelitis virus by in vitro cultivation in guinea pig heart cells. Am. J. Hyg. 1961;73:209–218.
    1. Burrer R., Neuman B.W., Ting J.P., Stein D.A., Moulton H.M., Iversen P.L., Kuhn P., Buchmeier M.J. Antiviral effects of antisense morpholino oligomers in murine Coronavirus infection models. J. Virol. 2007;81(11):5637–5648. - PMC - PubMed
    1. Caplen N.J., Zheng Z., Falgout B., Morgan R.A. Inhibition of viral gene expression and replication in mosquito cells by dsRNA-triggered RNA interference. Mol. Ther. 2002;6(2):243–251. - PubMed

Publication types

MeSH terms