. 2008 Aug;95(4):1890-901.
doi: 10.1529/biophysj.107.118109. Epub 2008 May 9.

Magnitude of sarcomere extension correlates with initial sarcomere length during lengthening of activated single fibers from soleus muscle of rats

Affiliations

Magnitude of sarcomere extension correlates with initial sarcomere length during lengthening of activated single fibers from soleus muscle of rats

Appaji Panchangam et al. Biophys J. 2008 Aug.

Abstract

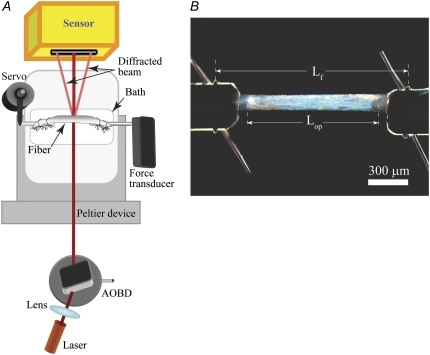
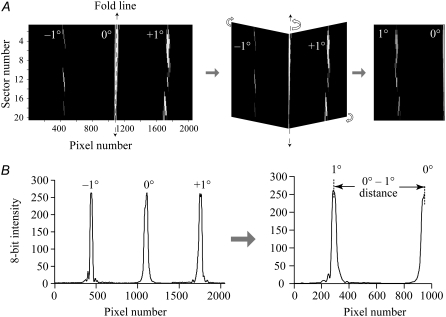
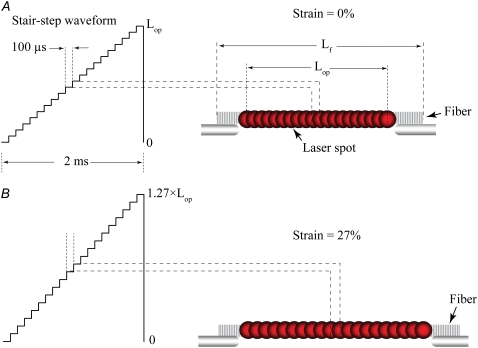
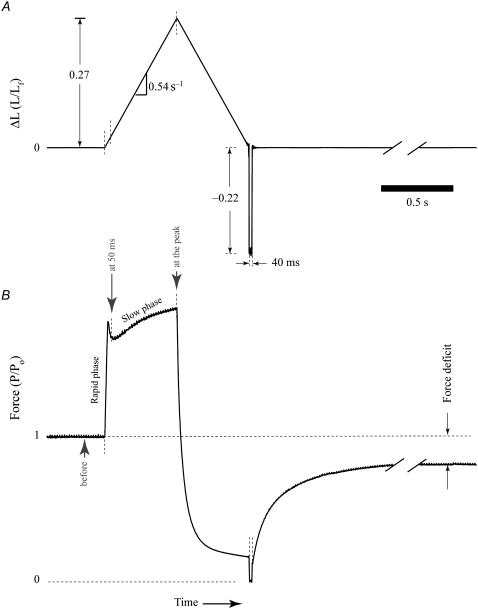
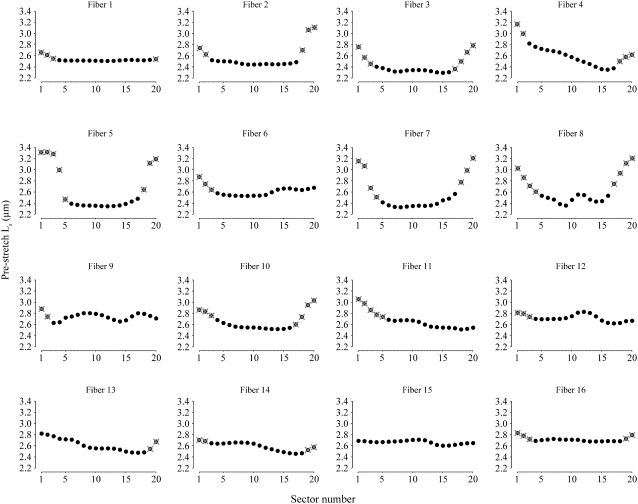
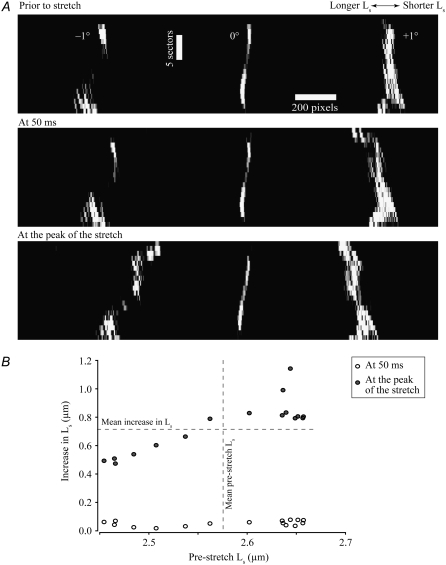
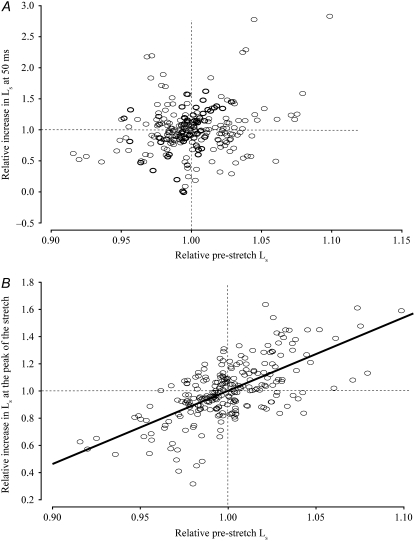
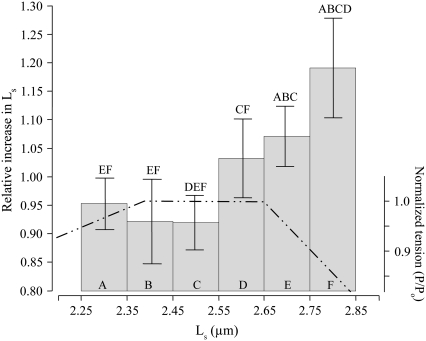
A laser-diffraction technique was developed that rapidly reports the lengths of sarcomeres (L(s)) in serially connected sectors of permeabilized single fibers. The apparatus translates a laser beam along the entire length of a fiber segment within 2 ms, with brief stops at each of 20 contiguous sectors. We tested the hypothesis that during lengthening contractions, when maximally activated fibers are stretched, sectors that contain the longer sarcomeres undergo greater increases in L(s) than those containing shorter sarcomeres. Fibers (n = 16) were obtained from the soleus muscles of adult male rats and the middle portions (length = 1.05 +/- 0.11 mm; mean +/- SD) were investigated. Single stretches of strain 27% and a strain rate of 54% s(-1) were initiated at maximum isometric stress and resulted in a 19 +/- 9% loss in isometric stress. The data on L(s) revealed that 1), the stretch was not distributed uniformly among the sectors, and 2), during the stretch, sectors at long L(s) before the stretch elongated more than those at short lengths. The findings support the hypothesis that during stretches of maximally activated skeletal muscles, sarcomeres at longer lengths are more susceptible to damage by excessive strain.


Figures

FIGURE 1
FIGURE 1
(A) Schematic diagram of the experimental apparatus. (B) Top view of a sample fiber (under dark-field illumination) mounted in the bath showing only the two innermost ties. The force-producing length (Lf) and the investigation length (Lop) were measured as indicated in the figure with the Ls of a central section adjusted to ∼2.5 μm.
FIGURE 2
FIGURE 2
Method to determine the diffraction angle. (A) Scheme to obtain the 1° diffraction patterns from the −1° and +1°. The grayscale map (left) represents the diffraction data (all 20 scans) from a full sweep of the fiber. The x axis of the map represents the pixel number, and the y axis the sector number. The grayscale intensity of the image is proportional to the 8-bit intensity of the diffraction patterns (black 0 to white 255). The dashed line represents the fold line obtained by fitting a straight line to the centroids of the intensity profiles of the undiffracted order (0°). (B) A typical 8-bit intensity profile (left) of the diffraction pattern corresponding to sector 10 of the grayscale map. The intensity on the y axis is in arbitrary units (0−255). The intensity profile in the right panel corresponds to the 1° and left half of the 0°. The distance between the 1° and 0° peak locations (separation in pixels × the pixel size) and the fiber-to-sensor distance were used to compute the diffraction angle.
FIGURE 3
FIGURE 3
Translation of the laser beam during a sweep. (A) A typical stair-step waveform (left) representing one complete sweep. The step height corresponds to the separation distance between the centers of two adjacent sectors, and the step width corresponds to the duration of time that the laser spot was locked at the sector. An illustration of the sweeping with overlapping laser spots for an unstretched fiber is shown on the right. (B) When fiber length was increased, the separation between the adjacent laser spots was increased such that the entire Lop span continued to be interrogated.
FIGURE 4
FIGURE 4
Experimental protocol. (A) Change in fiber length during the single stretch lengthening contraction protocol. Activated fibers were subjected to 27% stretch followed by shortening at constant speed. Immediately after the fibers were returned to original length, a step-shortening and stretch maneuver was inserted to indicate the zero of the force transducer on the force record. (B) A typical force response of the fiber to the single stretch protocol on the same timescale as shown in panel A. The force response of the fiber to stretch consisted of an initial phase of rapid increase followed by a phase of slow increase. The zero of the force transducer was established during the 40 ms hold after the step-shortening of the fiber. After the stretch, steady-state isometric stress was reassessed and used in force deficit calculations.
FIGURE 5
FIGURE 5
Sector exclusion map. Each panel shows the effect of the rate-limiting filter on the prestretch Ls profile of each of the 16 fibers. Note the increasing trend in prestretch Ls near the end-sectors. The sectors that were eliminated (solid circles with crosses through them) and those that were not eliminated (solid circles) with the rate-limiting filter are indicated on each Ls profile.
FIGURE 6
FIGURE 6
Representative diffraction images and Ls of an activated fiber (Fiber 12, Fig. 5) during the single stretch protocol. (A) Ls were computed from the diffraction images of the activated fibers obtained 100 ms before (top), 50 ms after the onset (middle), and at the peak of the stretch (bottom). Functional sectors were identified by applying the rate-limiting filter to the prestretch Ls, obtained from the top image. (B) For the accepted sectors, the increases in Ls during the stretch are plotted against the prestretch Ls. The graph shows a strong correlation (r = 0.86, p < 0.0001) between the increase in Ls at the peak of the stretch (shaded circles) and prestretch Ls, and indicates that sectors with prestretch Ls longer than the mean Ls stretched more than the mean increase in Ls (top-right quadrant). No such correlation was evident 50 ms after the onset of the stretch (open circles).
FIGURE 7
FIGURE 7
Effect of relative prestretch Ls on extensibility of sectors during stretch. The x axes represent relative prestretch Ls, the ratio of sector prestretch Ls to the mean Ls of the accepted sectors within a given fiber. (A) The y axis represents the relative increase in Ls 50 ms after the onset of the stretch (the ratio of the increase in sector Ls at 50 ms to the mean Ls increase at 50 ms). The relative increase in Ls did not correlate with relative prestretch Ls (r = 0.23, p = 0.0003). (B) The y axis represents the relative increase in Ls at the peak of the stretch (the ratio of the increase in sector Ls at the peak of the stretch to the mean Ls increase at the peak of the stretch). The relative increase in Ls correlated positively with the relative prestretch Ls (r = 0.65, p < 0.0001, slope = 5.4). The graph indicates that sectors with prestretch Ls longer than the mean of all accepted sectors within a given fiber extend more than the mean extension, and that sectors with shorter prestretch Ls than the mean extend less than the mean.
FIGURE 8
FIGURE 8
Relative increase in Ls at the peak of the stretch versus prestretch Ls. The data from all 16 fibers (245 sectors) were pooled and the relative increases in Ls of sectors were assigned to six different groups (A−F) according to the prestretch Ls values. The y axis on the left side of the graph represents the relative increase in Ls as a ratio of increase in Ls to mean increase in Ls for a given fiber, and the x axis represents the prestretch Ls of the sectors in μm. The groups were divided uniformly in the prestretch Ls range of 2.25–2.85 μm with an interval size of 0.1 μm. The group means and the error bars representing 95% confidence intervals for the means are shown in the figure. A one-way ANOVA to compare the group means resulted in a significant F-statistic (F = 8.31), indicating differences among groups. The post hoc comparisons identified pairwise differences (p < 0.05) as indicated above the bars of the histogram (e.g., group A is different from groups E and F). The Ls at which the shift in trend occurred coincided approximately with the beginning of the descending limb of the length-tension relationship (dash-dotted line, y axis on right-hand side) for the soleus muscles of rats.

Similar articles

Cited by

References

    1. Faulkner, J. A. 2003. Terminology for contractions of muscles during shortening, while isometric, and during lengthening. J. Appl. Physiol. 95:455–459. - PubMed
    1. McCully, K. K., and J. A. Faulkner. 1985. Injury to skeletal muscle fibers of mice following lengthening contractions. J. Appl. Physiol. 59:119–126. - PubMed
    1. Friden, J., M. Sjostrom, and B. Ekblom. 1983. Myofibrillar damage following intense eccentric exercise in man. Int. J. Sports Med. 4:170–176. - PubMed
    1. Newham, D. J., G. McPhail, K. R. Mills, and R. H. Edwards. 1983. Ultrastructural changes after concentric and eccentric contractions of human muscle. J. Neurol. Sci. 61:109–122. - PubMed
    1. Ogilvie, R. W., R. B. Armstrong, K. E. Baird, and C. L. Bottoms. 1988. Lesions in the rat soleus muscle following eccentrically biased exercise. Am. J. Anat. 182:335–346. - PubMed

LinkOut - more resources