Comparative Study
. 2008 Aug;95(4):1785-94.
doi: 10.1529/biophysj.108.131466. Epub 2008 May 9.

Random-walk model of diffusion in three dimensions in brain extracellular space: comparison with microfiberoptic photobleaching measurements

Affiliations
Comparative Study

Random-walk model of diffusion in three dimensions in brain extracellular space: comparison with microfiberoptic photobleaching measurements

Songwan Jin et al. Biophys J. 2008 Aug.

Abstract

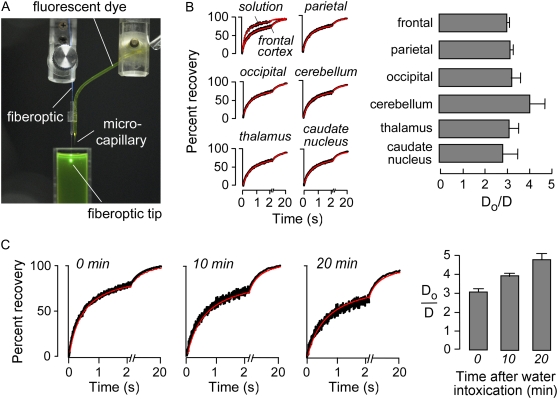
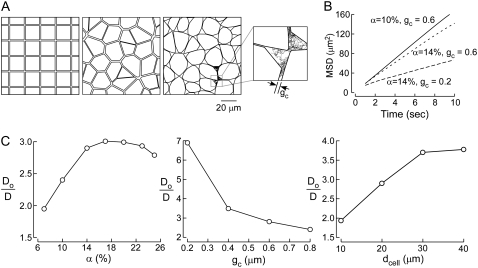
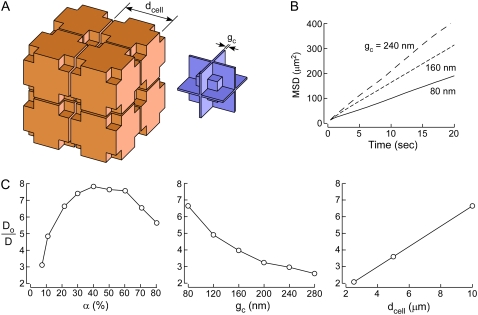
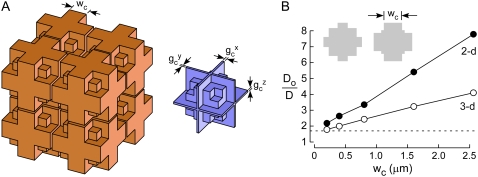
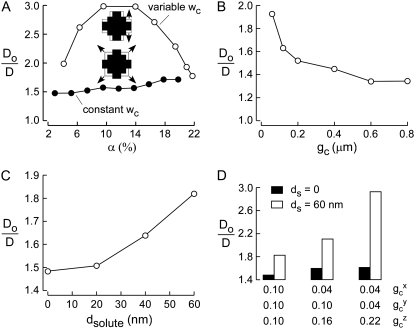
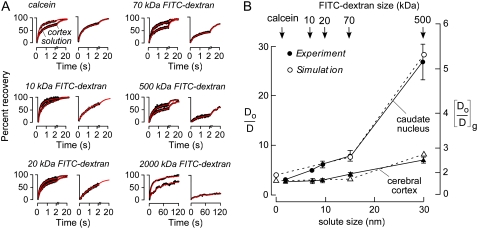
Diffusion through the extracellular space (ECS) in brain is important in drug delivery, intercellular communication, and extracellular ionic buffering. The ECS comprises approximately 20% of brain parenchymal volume and contains cell-cell gaps approximately 50 nm. We developed a random-walk model to simulate macromolecule diffusion in brain ECS in three dimensions using realistic ECS dimensions. Model inputs included ECS volume fraction (alpha), cell size, cell-cell gap geometry, intercellular lake (expanded regions of brain ECS) dimensions, and molecular size of the diffusing solute. Model output was relative solute diffusion in water versus brain ECS (D(o)/D). Experimental D(o)/D for comparison with model predictions was measured using a microfiberoptic fluorescence photobleaching method involving stereotaxic insertion of a micron-size optical fiber into mouse brain. D(o)/D for the small solute calcein in different regions of brain was in the range 3.0-4.1, and increased with brain cell swelling after water intoxication. D(o)/D also increased with increasing size of the diffusing solute, particularly in deep brain nuclei. Simulations of measured D(o)/D using realistic alpha, cell size and cell-cell gap required the presence of intercellular lakes at multicell contact points, and the contact length of cell-cell gaps to be least 50-fold smaller than cell size. The model accurately predicted D(o)/D for different solute sizes. Also, the modeling showed unanticipated effects on D(o)/D of changing ECS and cell dimensions that implicated solute trapping by lakes. Our model establishes the geometric constraints to account quantitatively for the relatively modest slowing of solute and macromolecule diffusion in brain ECS.


Figures

FIGURE 1
FIGURE 1
Experimental measurement of calcein diffusion in brain ECS in living mice. (A) Experimental setup, showing dual-lumen device housing a barrel to guide the microfiberoptic adjacent to a microcapillary for dye delivery. Conical illumination volume is produced at the fiberoptic tip. (B, left) Representative fluorescence recovery curves for microfiberoptic photobleaching measurements of calcein diffusion in ECS at indicated regions of mouse brain. (B, right) Averaged Do/D for calcein diffusion in aCSF versus brain ECS (SE, n = 4). (C, left) Recovery curves for calcein diffusion in cerebral cortex (400 μm beneath brain surface) before and at 10 and 20 min after intraperitoneal water administration. (C, right) Averaged data (SE, n = 4).
FIGURE 2
FIGURE 2
Two-dimensional models of diffusion in brain ECS. (A) Schematic of two-dimensional models: (left) square lattice model, α = 14%, gc = 1.45 μm; (middle) Voronoi cell model, α = 14%, gc ∼ 1.5 μm; and (right) Voronoi cell model with lakes at multicell contact points, α =14%, gc ∼ 0.6 μm. Inset at right shows random-walk path of a diffusing point-like particle. (B) Examples of MSD plots computed with the Voronoi cell-lake model. Parameters: dcell = 20 μm, with indicated gc and α. (C) Model behavior, showing Do/D for the Voronoi cell-lake model as a function of (left) α, (middle) gc, and (right) cell diameter, dcell. Parameters: (left) dcell = 20 μm, gc = 0.6 μm; (middle) α = 14%, dcell = 20 μm; (right) α = 14%, gc = 0.6 μm.
FIGURE 3
FIGURE 3
Three-dimensional model of diffusion in brain ECS. (A) Schematic of three-dimensional model of diffusion in brain ECS showing a cubic lattice arrangement of cells containing lakes at multicell contact points (left). ECS geometry with narrow gaps and lake regions (right). (B) Representative MSD plots. Parameters α ∼ 21.5%, dcell = 10 μm, and indicated gc. (C) Do/D as a function of (left) α, (middle) gc, and (right) dcell. Parameters: (left) dcell = 10 μm, gc = 80 nm; (middle) α ∼ 21.5%, dcell = 10 μm; (right) α ∼ 21.5%, gc = 80 nm.
FIGURE 4
FIGURE 4
Modeling experimental Do/D by a 3D model with modified lakes. (A) Schematic of three-dimensional brain ECS model with modified lakes, showing (left) cell arrangement, and (right) ECS geometry. Lake dimensions were modified such that the gap width spacing (wc) could be independently specified. In addition, gap size in each direction could be independently specified to introduce gap heterogeneity. (B) Do/D as a function of wc for the three-dimensional model (open circles) and the 2D model (closed circles) with the same cross sections as the 3D model. Parameters: α ∼ 21.5%, gc = 80 nm, dcell = 10 μm. (For the 2D model α was 15.4–20.6%.) The experimental target line (dashed), Do/D = 1.7, is shown.
FIGURE 5
FIGURE 5
Characteristics of the modified lake model of 3D diffusion in brain ECS. (A) Do/D as a function of α. Two types of modifications were made to change α—altered wc (open circles) and fixed wc (altered lake mass, solid circles). Parameters: gc = 80 nm, dcell = 10 μm. (B) Do/D as a function of gc. Parameters: α = 21.8–22.6%, dcell = 10 μm. (C) Do/D as a function of dsolute. Parameters: gc = 100 nm, α = 21.9%, dcell = 5 μm. (D) Effect of heterogeneity in gc. Do/D shown for zero solute size (solid bars) and 60 nm solute size (open bars). Parameters: α = 21.9%, dcell = 5 μm.
FIGURE 6
FIGURE 6
Model comparisons with experimental data for solute size-dependent diffusion in mouse brain ECS. (A) Representative fluorescence recovery curves of indicated fluorescent dyes in cerebral cortex (left) and caudate nucleus (right). (B) Summary showing Do/D for ECS diffusion as a function of solute size (dsolute) in cerebral cortex (triangles) and caudate nucleus (circles) (SE, n = 5). Experimental data (solid) and simulated results (open) are overlaid. Simulation parameters: (gcx, gcy, gcz) = (40, 40, 40) nm for cerebral cortex, (gcx, gcy, gcz) = (10, 25, 45) nm for caudate nucleus, α ∼ 20%, dcell = 5 μm, wc = 90 nm.

Similar articles

Cited by

References

    1. Mazel, T., Z. Simonova, and E. Sykova. 1998. Diffusion heterogeneity and anisotropy in rat hippocampus. Neuroreport. 9:1299–1304. - PubMed
    1. Nicholson, C., and E. Sykova. 1998. Extracellular space structure revealed by diffusion analysis. Trends Neurosci. 21:207–215. - PubMed
    1. Nicholson, C., K. C. Chen, S. Hrabetova, and L. Tao. 2000. Diffusion of molecules in brain extracellular space: theory and experiment. Prog. Brain Res. 125:129–154. - PubMed
    1. Binder, D. K., M. C. Papadopoulos, P. M. Haggie, and A. S. Verkman. 2004. In vivo measurement of brain extracellular space diffusion by cortical surface photobleaching. J. Neurosci. 24:8049–8056. - PMC - PubMed
    1. Kume-Kick, J., T. Mazel, I. Vorisek, S. Hrabetova, L. Tao, and C. Nicholson. 2002. Independence of extracellular tortuosity and volume fraction during osmotic challenge in rat neocortex. J. Physiol. 542:515–527. - PMC - PubMed

Publication types

LinkOut - more resources