. 2008 Aug;95(4):1837-50.
doi: 10.1529/biophysj.108.129437. Epub 2008 May 9.

Kinetics, statistics, and energetics of lipid membrane electroporation studied by molecular dynamics simulations

Affiliations

Kinetics, statistics, and energetics of lipid membrane electroporation studied by molecular dynamics simulations

Rainer A Böckmann et al. Biophys J. 2008 Aug.

Abstract

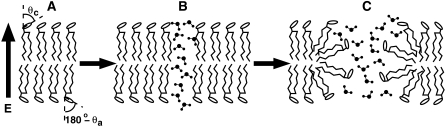
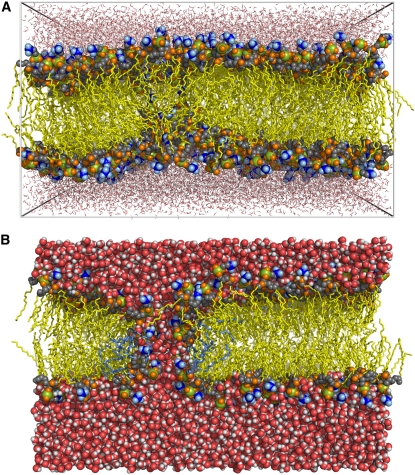
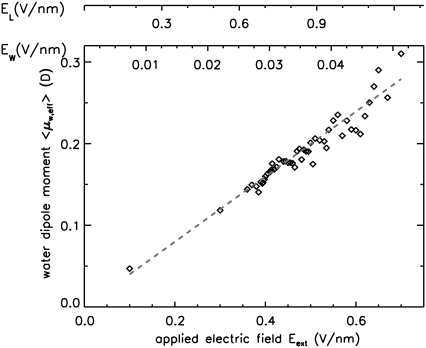
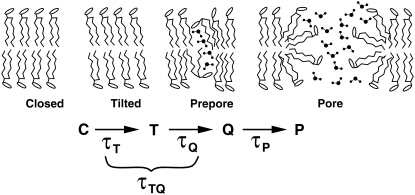
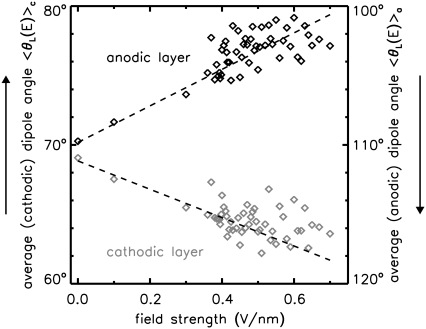
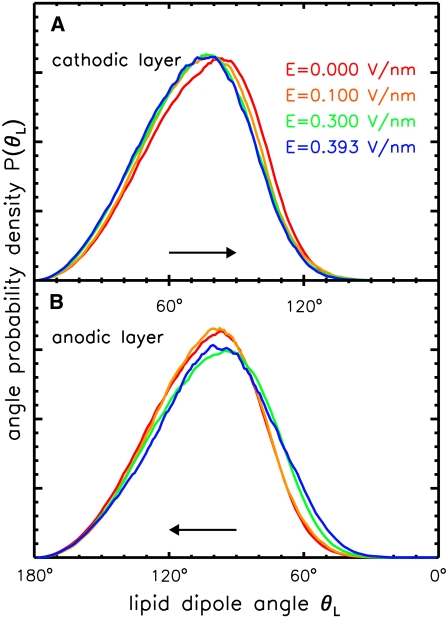
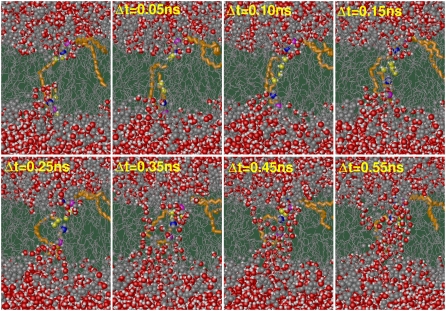
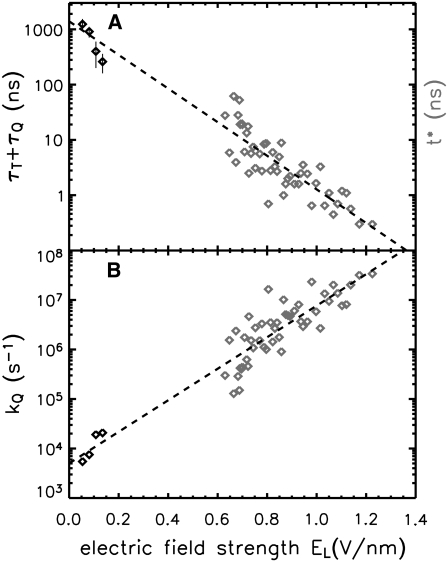
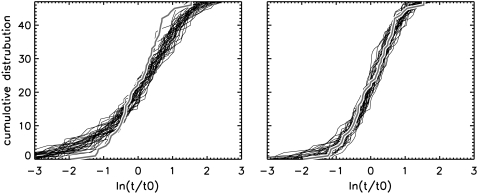
Membrane electroporation is the method to directly transfer bioactive substances such as drugs and genes into living cells, as well as preceding electrofusion. Although much information on the microscopic mechanism has been obtained both from experiment and simulation, the existence and nature of possible intermediates is still unclear. To elucidate intermediates of electropore formation by direct comparison with measured prepore formation kinetics, we have carried out 49 atomistic electroporation simulations on a palmitoyl-oleoyl-phosphatidylcholine bilayer for electric field strengths between 0.04 and 0.7 V/nm. A statistical theory is developed to facilitate direct comparison of experimental (macroscopic) prepore formation kinetics with the (single event) preporation times derived from the simulations, which also allows us to extract an effective number of lipids involved in each pore formation event. A linear dependency of the activation energy for prepore formation on the applied field is seen, with quantitative agreement between experiment and simulation. The distribution of preporation times suggests a four-state pore formation model. The model involves a first intermediate characterized by a differential tilt of the polar lipid headgroups on both leaflets, and a second intermediate (prepore), where a polar chain across the bilayer is formed by 3-4 lipid headgroups and several water molecules, thereby providing a microscopic explanation for the polarizable volume derived previously from the measured kinetics. An average pore radius of 0.47 +/- 0.15 nm is seen, in favorable agreement with conductance measurements and electrooptical experiments of lipid vesicles.


Figures

FIGURE 1
FIGURE 1
Sketch of a cross section through a lipid bilayer: ideal, at E = 0 V/m (A), a small hydrophobic pore intermediate (B) during electropore formation, and the stable hydrophilic pore (C), where the pore wall contains tilted lipids with the dipolar headgroups aligned parallel to the external field vector Eext. θ is the average angle between the (lipid) molecular dipole moment (μ) and Eext. On the cathodic side, θc = 70 ± 2°, and on the anodic side, θa = 110 ± 2°.
FIGURE 2
FIGURE 2
Simulation system with 512 POPC lipids after prepore formation (snapshot after 900 ps) at an electric field strength of E = 0.5 V/nm (A) and after 50 ns subsequent equilibration at a decreased field strength of E = 0.04 V/nm (B). Lipid tails are depicted as yellow sticks, the choline groups as blue spheres, the phosphor atoms in green, lipid oxygen atoms in orange, and lipid head carbon atoms in gray. Water is shown in stick representation (A) and in space-filled representation (B), respectively. In panel B, a cut through the center of the pore is shown.
FIGURE 3
FIGURE 3
Average effective bulk water dipole moments 〈μw,eff〉 in field direction as a function of the applied electric field Eext and as a function of the macroscopic electric field in the water EW and in the lipid phase EL (see text). The dashed line shows the average water dipole moment according to Eq. 3 as a function of EW. The total molecular dipole moment for the SPC water model is 2.27 D (61), from experiment a value of 2.9 ± 0.6 D was reported (62).
FIGURE 4
FIGURE 4
Kinetic model of pore formation. In a first step, resulting in intermediate T, the polar lipid headgroups become tilted. Tilting occurs in opposite directions for the two leaflets. In a second step, Q, one or two lipid headgroups and a few water molecules intrude into the bilayer and form a polar chain. Pore formation, P, is the last step considered in this work.
FIGURE 5
FIGURE 5
Average lipid dipole orientation. Shown are the average angles θ to the membrane normal in the direction of the applied external electric field separately for the two monolayers as a function of the applied field strength. The dashed lines show a linear fit to the data.
FIGURE 6
FIGURE 6
Lipid dipole angle probability density P(θL) as a function of the angle θL with respect to the membrane normal in the direction of the applied external electric field, separately for the two monolayers and for different field strengths (color-coded).
FIGURE 7
FIGURE 7
Number of protrusions (per nanosecond) for various electric field strengths. The averages are shown as dashed lines.
FIGURE 8
FIGURE 8
Average water molecule dipole distributions. Shown are the dipole angle (θ) distributions with respect to the z axis as a function of position across the bilayer (z) for four different simulations with different field strengths (A, E = 0.0 V/nm; B, E = 0.1 V/nm; C, E = 0.3 V/nm; and D, E = 0.393 V/nm). The distributions are weighted with sin(θ). The color reflects the relative water density for the particular angle θ of the respective slice, e.g., in the green colored regions, the water dipoles are isotropically distributed and in the red areas, a 50% excess of the affected angles with respect to the bulk water phase is observed. In the lipid headgroup region, the water dipoles are oppositely directed to the lipid dipoles, i.e., they are pointing into the hydrophobic core.
FIGURE 9
FIGURE 9
Primary electroporation events. Shown are snapshots of the electropore formation at E = 0.395 V/nm (after 18.7 ns). Lipids and water molecules guiding the initial steps are highlighted, the lipid headgroups are shown as gray balls, water oxygens as red balls, and lipid tails as sticks. Water molecules forming the initial membrane-spanning water file are colored yellow.
FIGURE 10
FIGURE 10
Electrostatic potential (A), field strength (B), and force on a dipole of strength 1 D (1 Debye = 3.33564 · 10−30 Cm) (C) across the lipid bilayer for three different field strengths. The region imposing asymmetry among the two monolayers is shaded. The direction of the external applied electric field is given by a solid arrow (B), the average water dipole direction by green arrows (C). The electric field strengths were obtained by integration of the averaged charge density across the bilayer, after summing the charges per slice (box divided in 200 slices), the electrostatic potential was computed by double integration of the charge density. The force on a dipole was obtained by numerical differentiation of the electric field strength. The force was smoothed with a Gaussian with a width of 0.08 nm.
FIGURE 11
FIGURE 11
Preporation time t* (simulation, shaded symbols) and experimental time constant τT + τQ (solid symbols, A), and pore formation rate coefficient kQ (B) as a function of the effective macroscopic electric field EL across the lipid bilayer. Data from experiment are shown in solid representation (32). The dashed line is a fit to the simulation data according to t* ∼ exp (−ΔμEL).
FIGURE 12
FIGURE 12
E-field-normalized cumulative distribution functions (thick shaded lines, logarithmic timescale) obtained from the 48 individual poration times observed in the molecular dynamics simulations. (Left) Superimposed are 25 cumulative distribution functions for 48 events each, drawn from an exponential distribution, corresponding to a one-step kinetics with no intermediates. (Right) Here, the 25 cumulative distributions were drawn from two-step kinetics, i.e., assuming one intermediate.

References

    1. Neumann, E., M. Schaefer-Ridder, Y. Wang, and P. H. Hofschneider. 1982. Gene transfer into mouse lyoma cells by electroporation and electroporative delivery of drugs and genes. EMBO J. 1:841–845. - PMC - PubMed
    1. Sale, A. J. H., and W. A. Hamilton. 1967. Effects of high electric fields on microorganisms. I. Killing of bacteria and yeast. Biochim. Biophys. Acta. 148:781–788.
    1. Neumann, E., and K. Rosenheck. 1972. Permeability changes induced by electric impulses in vesicular membranes. J. Mol. Biol. 10:279–290. - PubMed
    1. Belehradek, M., C. Domenge, B. Luboinski, S. Orlowski, J. Belehradek, and L. M. Mir. 1993. Electrochemotherapy, a new antitumor treatment. First clinical phase I–II trial. Cancer. 72:3694–3700. - PubMed
    1. Mir, L. M., S. Orlowski, J. Belehradek, J. Teissie, M. P. Rols, G. Sersa, D. Miklavcic, R. Gilbert, and R. Heller. 1995. Biomedical applications of electric pulses with special emphasis on antitumor electrochemotherapy. Bioelectrochem. Bioenerg. 38:203–207.

Publication types

MeSH terms

LinkOut - more resources