

Mitochondria-dependent regulation of Kv currents in rat pulmonary artery smooth muscle cells
- PMID: 18469114
- PMCID: PMC2494784
- DOI: 10.1152/ajplung.90243.2008
Mitochondria-dependent regulation of Kv currents in rat pulmonary artery smooth muscle cells
Abstract
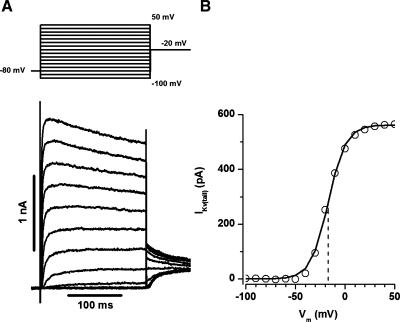
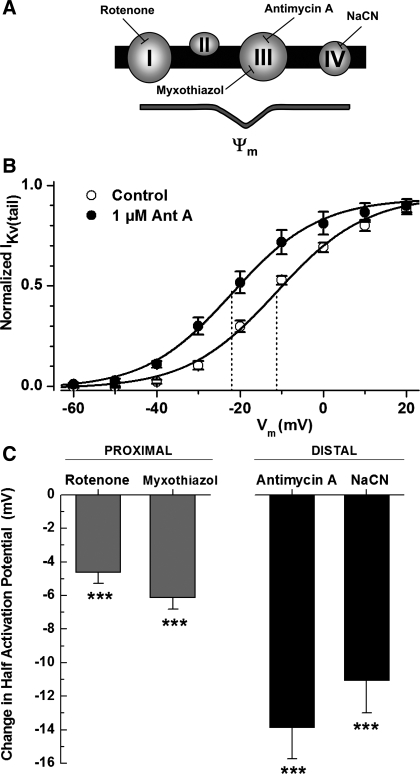
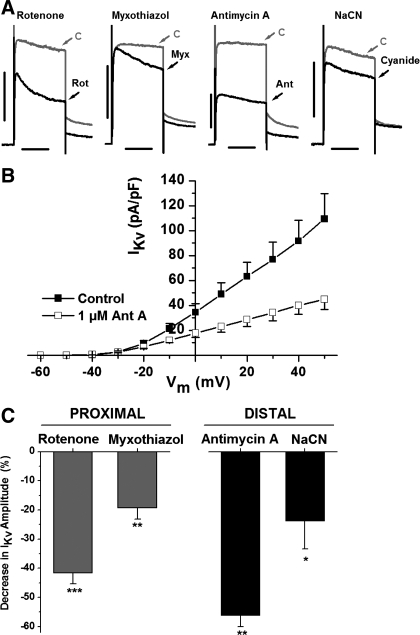
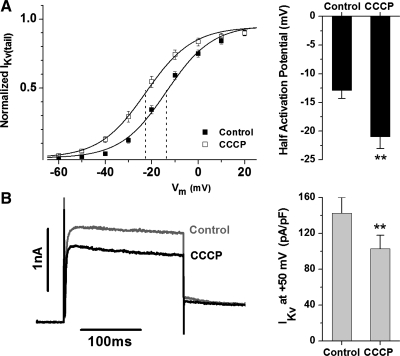
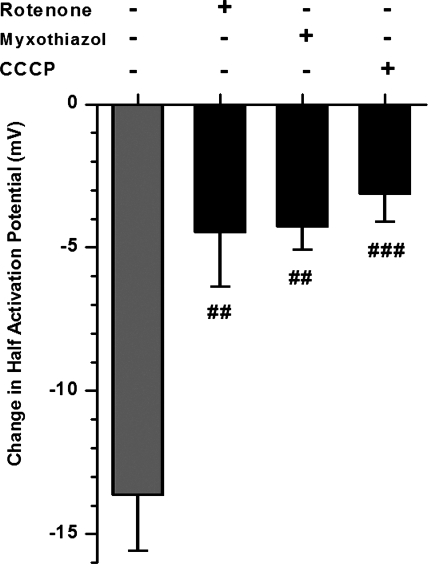
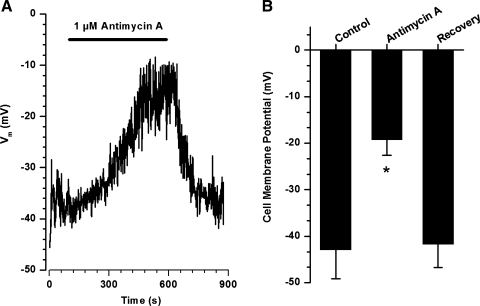
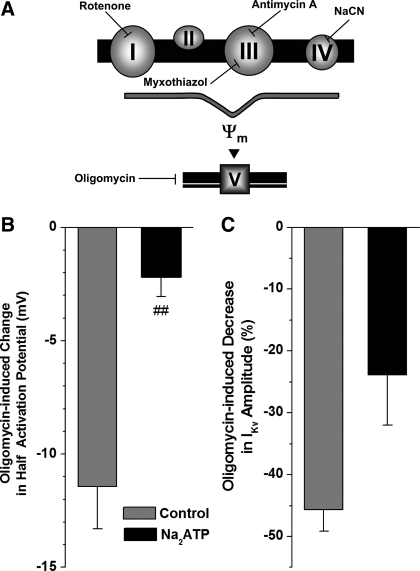
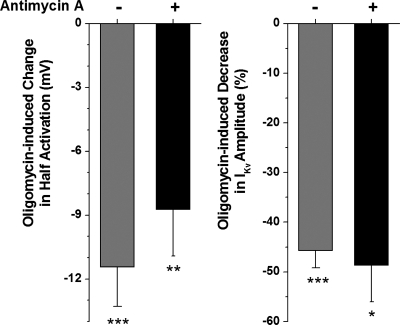
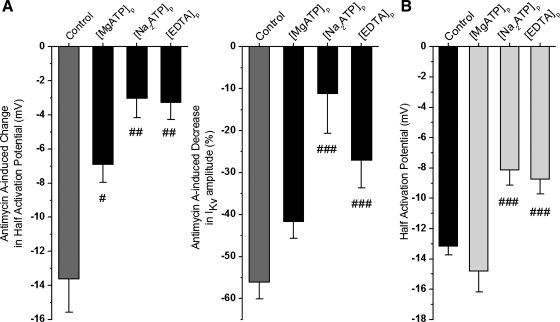
Voltage-gated K(+) (Kv) channels are important in the regulation of pulmonary vascular function having both physiological and pathophysiological implications. The pulmonary vasculature is essential for reoxygenation of the blood, supplying oxygen for cellular respiration. Mitochondria have been proposed as the major oxygen-sensing organelles in the pulmonary vasculature. Using electrophysiological techniques and immunofluorescence, an interaction of the mitochondria with Kv channels was investigated. Inhibitors, blocking the mitochondrial electron transport chain at different complexes, were shown to have a dual effect on Kv currents in freshly isolated rat pulmonary arterial smooth muscle cells (PASMCs). These dual effects comprised an enhancement of Kv current in a negative potential range (manifested as a 5- to 14-mV shift in the Kv activation to more negative membrane voltages) with a decrease in current amplitude at positive potentials. Such effects were most prominent as a result of inhibition of Complex III by antimycin A. Investigation of the mechanism of antimycin A-mediated effects on Kv channel currents (I(Kv)) revealed the presence of a mitochondria-mediated Mg(2+) and ATP-dependent regulation of Kv channels in PASMCs, which exists in addition to that currently proposed to be caused by changes in intracellular reactive oxygen species.
Figures
Similar articles
-
AMP-activated protein kinase inhibits Kv 1.5 channel currents of pulmonary arterial myocytes in response to hypoxia and inhibition of mitochondrial oxidative phosphorylation.J Physiol. 2016 Sep 1;594(17):4901-15. doi: 10.1113/JP272032. Epub 2016 Jun 30. J Physiol. 2016. PMID: 27062501 Free PMC article.
-
Cellular localization of mitochondria contributes to Kv channel-mediated regulation of cellular excitability in pulmonary but not mesenteric circulation.Am J Physiol Lung Cell Mol Physiol. 2009 Mar;296(3):L347-60. doi: 10.1152/ajplung.90341.2008. Epub 2008 Dec 19. Am J Physiol Lung Cell Mol Physiol. 2009. PMID: 19098127 Free PMC article.
-
Beraprost Upregulates KV Channel Expression and Function via EP4 Receptor in Pulmonary Artery Smooth Muscle Cells Obtained from Rats with Hypoxia-Induced Pulmonary Hypertension.J Vasc Res. 2019;56(4):204-214. doi: 10.1159/000500424. Epub 2019 Jun 12. J Vasc Res. 2019. PMID: 31189158
-
The role of k+ channels in determining pulmonary vascular tone, oxygen sensing, cell proliferation, and apoptosis: implications in hypoxic pulmonary vasoconstriction and pulmonary arterial hypertension.Microcirculation. 2006 Dec;13(8):615-32. doi: 10.1080/10739680600930222. Microcirculation. 2006. PMID: 17085423 Review.
-
Molecular identification of O2 sensors and O2-sensitive potassium channels in the pulmonary circulation.Adv Exp Med Biol. 2000;475:219-40. doi: 10.1007/0-306-46825-5_21. Adv Exp Med Biol. 2000. PMID: 10849663 Review.
Cited by
-
Intratracheal instillation of ethyl pyruvate nanoparticles prevents the development of shunt-flow-induced pulmonary arterial hypertension in a rat model.Int J Nanomedicine. 2016 Jun 3;11:2587-99. doi: 10.2147/IJN.S103183. eCollection 2016. Int J Nanomedicine. 2016. PMID: 27354791 Free PMC article.
-
Kv3.4 is modulated by HIF-1α to protect SH-SY5Y cells against oxidative stress-induced neural cell death.Sci Rep. 2017 May 18;7(1):2075. doi: 10.1038/s41598-017-02129-w. Sci Rep. 2017. PMID: 28522852 Free PMC article.
-
An Update on Advancements and Challenges in Inhalational Drug Delivery for Pulmonary Arterial Hypertension.Molecules. 2022 May 29;27(11):3490. doi: 10.3390/molecules27113490. Molecules. 2022. PMID: 35684428 Free PMC article. Review.
-
AMP-activated protein kinase inhibits Kv 1.5 channel currents of pulmonary arterial myocytes in response to hypoxia and inhibition of mitochondrial oxidative phosphorylation.J Physiol. 2016 Sep 1;594(17):4901-15. doi: 10.1113/JP272032. Epub 2016 Jun 30. J Physiol. 2016. PMID: 27062501 Free PMC article.
-
Cellular localization of mitochondria contributes to Kv channel-mediated regulation of cellular excitability in pulmonary but not mesenteric circulation.Am J Physiol Lung Cell Mol Physiol. 2009 Mar;296(3):L347-60. doi: 10.1152/ajplung.90341.2008. Epub 2008 Dec 19. Am J Physiol Lung Cell Mol Physiol. 2009. PMID: 19098127 Free PMC article.
References
-
- Agus ZS, Morad M. Modulation of cardiac ion channels by magnesium. Annu Rev Physiol 53: 299–307, 1991. - PubMed
-
- Archer SL, Huang J, Henry T, Peterson D, Weir EK. A redox-based O2 sensor in rat pulmonary vasculature. Circ Res 73: 1100–1112, 1993. - PubMed
-
- Archer SL, Wu XC, Thébaud B, Nsair A, Bonnet S, Tyrrell B, McMurtry MS, Hashimoto K, Harry G, Michelakis ED. Preferential expression and function of voltage-gated, O2-sensitive K+ channels in resistance pulmonary arteries explains regional heterogeneity in hypoxic pulmonary vasoconstriction: ionic diversity in smooth muscle cells. Circ Res 95: 308–318, 2004. - PubMed
-
- Budinger GR, Duranteau J, Chandel NS, Schumacker PT. Hibernation during hypoxia in cardiomyocytes. Role of mitochondria as the O2 sensor. J Biol Chem 273: 3320–3326, 1998. - PubMed
Publication types
MeSH terms
Substances
Grants and funding
LinkOut - more resources
Full Text Sources