. 2008 Jun;9(6):613-22.
doi: 10.1038/ni.1612. Epub 2008 May 11.

Foxo1 directly regulates the transcription of recombination-activating genes during B cell development

Affiliations

Foxo1 directly regulates the transcription of recombination-activating genes during B cell development

Rupesh H Amin et al. Nat Immunol. 2008 Jun.

Abstract

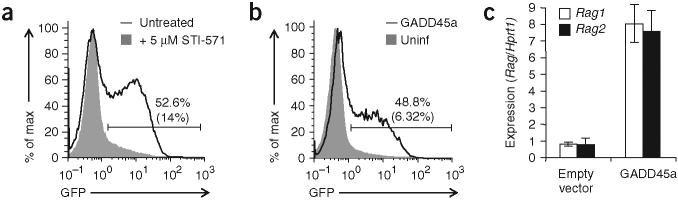
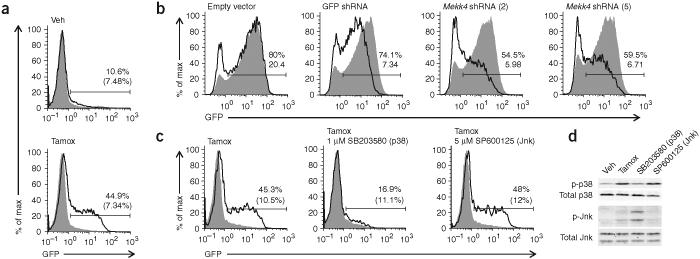
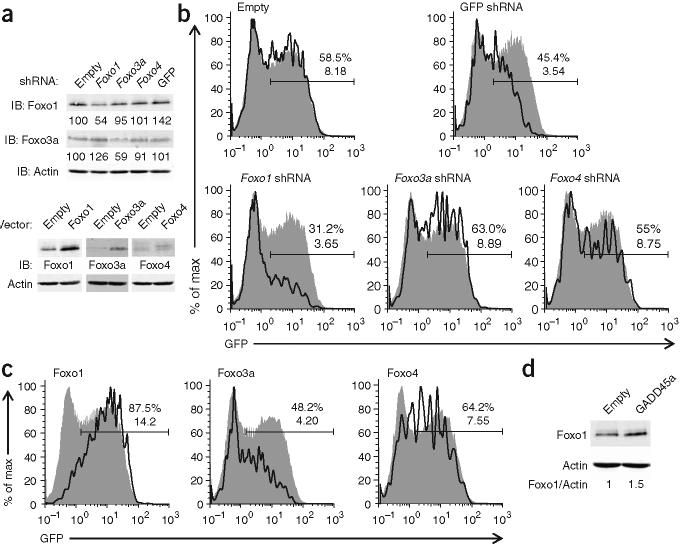
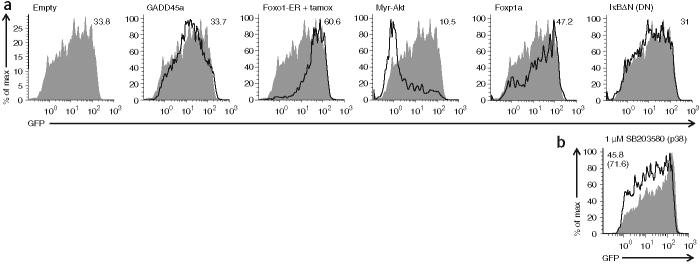
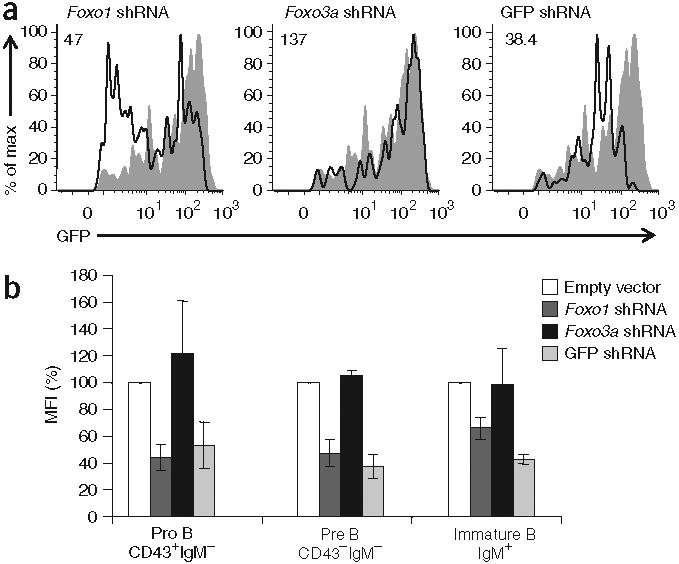
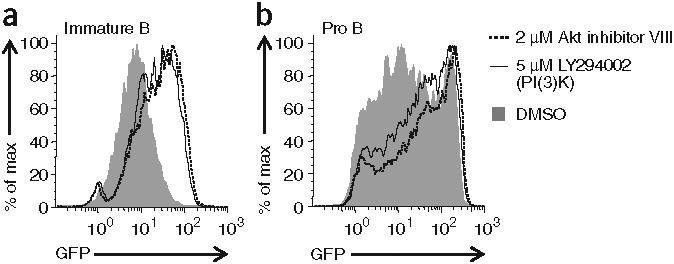
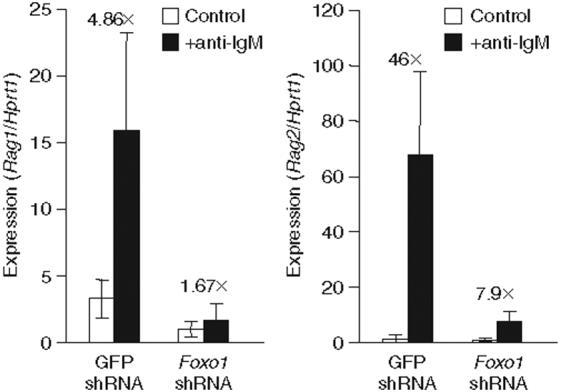
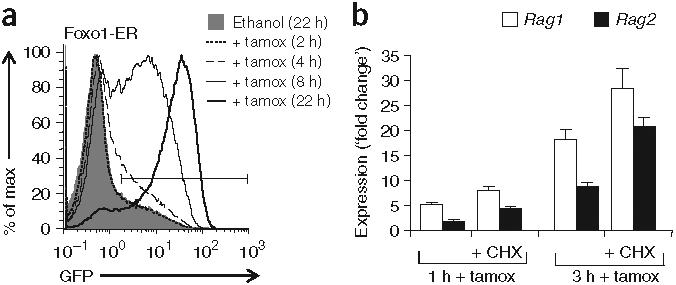
Regulated expression of the recombinase RAG-1 and RAG-2 proteins is necessary for generating the vast repertoire of antigen receptors essential for adaptive immunity. Here, a retroviral cDNA library screen showed that the stress-regulated protein GADD45a activated transcription of the genes encoding RAG-1 and RAG-2 in transformed pro-B cells by a pathway requiring the transcription factor Foxo1. Foxo1 directly activated transcription of the Rag1-Rag2 locus throughout early B cell development, and a decrease in Foxo1 protein diminished the induction of Rag1 and Rag2 transcription in a model of receptor editing. We also found that transcription of Rag1 and Rag2 was repressed at the pro-B cell and immature B cell stages by the kinase Akt through its 'antagonism' of Foxo1 function. Thus, Foxo1 is a key regulator of Rag1 and Rag2 transcription in primary B cells.


Figures

Figure 1
Figure 1
Identification of Gadd45a by a retroviral cDNA library screen for factors that induce Rag1 transcription in AMuLV-transformed B cells. (a) Flow cytometry of GFP expression in AMuLVtransformed Rag1-GFP B cells in normal culture conditions (filled histogram) or treated for 24 h with 5 μM STI-571 (solid line). Vertical axis (‘% of max’) indicates a scale of relative cell numbers with the median value set as 100%. (b) Flow cytometry of GFP expression in cells left uninfected (Uninf) or infected with retrovirus expressing Gadd45a (GADD45a), labeled with anti-Thy-1.1 (retroviral marker) and gated for infected Thy-1.1+ cells (solid line) or uninfected Thy-1.1 cells (filled histogram). Numbers above bracketed lines indicate percent GFP+ cells in the infected population (top number) and uninfected population (bottom number in parenthesis). (c) Quantitative RT-PCR analysis of Rag1 and Rag2 transcripts in sorted cells infected with empty vector retrovirus or retrovirus expressing GADD45a. Values are normalized to Hprt1 transcript abundance and are presented relative to expression in cells transduced with empty vector, set as 1. All data are representative of at least three independent experiments.
Figure 2
Figure 2
GADD45a induces Rag1 transcription by a MEKK4- and p38-dependent pathway. (a) Flow cytometry of GFP expression in AMuLV-transformed Rag1-GFP cells infected with retrovirus expressing ER-GADD45a (Thy-1.1+; solid lines) and treated for 18 h with vehicle control (Veh) or tamoxifen (Tamox). Filled histograms, uninfected cells (Thy-1.1) in the same culture. Numbers above bracketed lines indicate percent GFP+ cells in the infected population (top number) and uninfected population (bottom number in parenthesis). (b) GFP expression in ER-GADD45a-expressing cells infected with retrovirus encoded shRNA (above plots) and treated with tamoxifen for 24 h, then labeled with anti-hCD2 and gated for infected cells (expressing shRNA; solid lines) or uninfected cells (not expressing shRNA; filled histograms). Numbers above bracketed lines indicate percent GFP+ cells (top number) and mean fluorescence intensity (bottom number) in the shRNA-expressing population. Empty vector does not contain shRNA; GFP shRNA targets the transcript encoding GFP and serves as a positive control for GFP knockdown. (c) Flow cytometry of GFP expression in ER-GADD45a-expressing cells treated for 18 h with tamoxifen with or without a p38 or Jnk inhibitor, analyzed and gated as described in a. (d) Immunoblot of total and phosphorylated (p-) p38 and Jnk in ER-GADD45a-expressing cells treated for 6 h as described in c. In the Jnk blot, the lower band is Jnk1 (p46) and the upper band is Jnk2 and Jnk3 (p54). All data are representative of at least two independent experiments.
Figure 3
Figure 3
Foxo1 functions ‘downstream’ of GADD45a to increase Rag1 transcription in AMuLV-transformed pro-B cells. (a) Immunoblot analysis of Foxo1, Foxo3A and Foxo4 in AMuLV-transformed B cells infected with retroviruses expressing shRNA (top) or mRNA (bottom). For shRNA knockdown, numbers below lanes indicate the amount of Foxo1 or Foxo3a, after normalization to β-actin (loading control), relative to that in cells infected with empty vector (set as 100). Foxo4 protein is undetectable in the absence of overexpression. For protein overexpression, cells infected with retrovirus-expressing Foxo protein are compared with cells infected with empty vector retrovirus, with β-actin as a loading control. (b,c) GFP expression in ER-GADD45a-expressing cells infected with retrovirus encoding shRNA (b) or mRNA (c) and treated with tamoxifen for 24 h, then labeled with anti-hCD2 or anti-Thy-1.1 and gated for infected cells (solid lines) or uninfected cells (filled histograms). Numbers above bracketed lines indicate percent GFP+ cells (top number) and the mean fluorescence intensity (bottom number). (d) Immunoblot analysis of Foxo1 in AMuLV-transformed B cells infected with empty virus retrovirus or retrovirus expressing GADD45a. Numbers below lanes indicate the ratio of Foxo1 to β-actin. All data are representative of three independent experiments.
Figure 4
Figure 4
Overexpression of Foxo1 increases Rag1 transcription in primary B lymphocytes, whereas constitutively active Akt suppresses it. (a) GFP expression in cultured B220+IgM− bone marrow B cells from Rag1-GFP-heterozygous mice, infected with various retroviral vectors (above plots; gated on retrovirus-infected cells; solid lines) or empty vector (filled histograms; repeated in each plot for reference), collected 3-4 d later and labeled with antibodies to delineate B cell developmental subsets and ‘mark’ retrovirus-infected cells; cells infected with retrovirus expressing Foxo1-ER were additionally treated with tamoxifen for 9 h before analysis. Numbers at top right indicate GFP mean fluorescence intensity (all cells are GFP+ compared with non-B cells in the same culture). Myr-Akt, myristilated Akt; IκBΔN (DN), dominant negative form of IκBα. (b) GFP expression in B220+IgM- bone marrow B cells from Rag1-GFP-heterozygous mice, cultured for 2 d in the presence of IL-7 (2 ng/ml) and 1 μM SB203580 (p38 inhibitor; solid line) or DMSO vehicle alone (filled histogram). Numbers at top left indicate GFP mean fluorescence intensity for cells treated with SB203580 (top number) or DMSO (bottom number in parenthesis). All data are representative of at least two independent experiments.
Figure 5
Figure 5
A decrease in Foxo1 protein in primary B lymphocytes decreases Rag1 transcription at all stages of B cell development. (a) GFP expression in cultured hCD2+B220+CD43IgM bone marrow pre-B cells from Rag1-GFP-heterozygous mice, infected with retrovirus expressing shRNA specific for Foxo1, Foxo3a or GFP (solid lines) or empty vector (filled histograms; repeated in each plot for reference), collected 3-4 d later and labeled with antibodies to delineate B cell developmental subsets and ‘mark’ retrovirus-infected cells. Numbers at top left indicate GFP mean fluorescence intensity; the value for the population infected with empty vector retrovirus is 127. (b) GFP mean fluorescence intensity (MFI) for shRNA retrovirus infection experiments done as described in a, presented as a percent of the GFP mean fluorescence intensity for the population infected with empty vector retrovirus (set as 100%), analyzing pro-B cell, pre-B cell and immature B cell populations gated on live cells and B220. Data are representative of three experiments (a) or are the average of three independent experiments (±s.d.; b).
Figure 6
Figure 6
IL-7R and BCR signaling repress Rag transcription through the PI(3)K-Akt signaling axis. (a) GFP expression in B220+IgM+IgD primary immature B cells from Rag1-GFP-heterozygous mice, cultured for 24 h with Akt or PI(3)K inhibitors or DMSO vehicle alone. (b) GFP expression in large B220+CD43+IgM bone marrow B cells from Rag1-GFP-heterozygous mice, cultured for 4 d in the presence of IL-7 (2 ng/ml), then treated for an additional 2 d with Akt or PI(3)K inhibitors or DMSO vehicle alone (while still in the presence of IL-7) and then collected and labeled with antibodies to distinguish developing B cell subsets. Data are representative of two independent experiments.
Figure 7
Figure 7
A decrease in Foxo1 protein in primary immature B cells interferes with Rag1 and Rag2 transcript induction in response to BCR crosslinking. Quantitative RT-PCR analysis of Rag1 or Rag2 transcripts in cultured immature B cells from Rag1-GFP-heterozygous mice, infected with retrovirus encoding shRNA targeting either GFP or Foxo1, then collected 4 dlater, labeled with the appropriate antibodies and sorted by flow cytometry to isolate B220loIgM+ immature B cells bearing the retroviral marker protein. Sorted immature B cells were then left untreated or incubated for 12-15 h with anti-IgM before being collected for RNA isolation. Rag1 and Rag2 transcripts quantified by real-time PCR were normalized to Hprt1 transcripts, with the lowest value set as 1. Numbers above bars indicate the ‘fold difference’ (×) in transcript abundance between control cells and cells treated with anti-IgM. Data are representative of two independent experiments.
Figure 8
Figure 8
Foxo1 acts directly on the Rag locus. (a) Flow cytometry of GFP expression in AMuLV-transformed Rag1-GFP pro-B cells expressing Foxo1-ER protein and treated for 2-22 h (key) with tamoxifen or ethanol (vehicle control). (b) Quantitative RT-PCR analysis of Rag1 and Rag2 transcripts in the cells in a, treated for 1 or 3 h with tamoxifen or cyclohexamide (CHX) or both. Data are presented as the ratio of Rag mRNA in tamoxifen-treated cells to that in ethanol vehicle-treated control cells; Rag transcript abundance was normalized to that of Hprt1 transcripts. Data are representative of two independent experiments.

References

    1. Schatz DG. V(D)J recombination. Immunol. Rev. 2004;200:5–11. - PubMed
    1. Borghesi L, et al. B lineage-specific regulation of V(D)J recombinase activity is established in common lymphoid progenitors. J. Exp. Med. 2004;199:491–502. - PMC - PubMed
    1. Grawunder U, et al. Down-regulation of RAG1 and RAG2 gene expression in PreB cells after functional immunoglobulin heavy chain rearrangement. Immunity. 1995;3:601–608. - PubMed
    1. Verkoczy L, et al. Basal B cell receptor-directed phosphatidylinositol 3-kinase signaling turns off RAGs and promotes B cell-positive selection. J. Immunol. 2007;178:6332–6341. - PMC - PubMed
    1. Halverson R, Torres RM, Pelanda R. Receptor editing is the main mechanism of B cell tolerance toward membrane antigens. Nat. Immunol. 2004;5:645–650. - PubMed

Publication types

MeSH terms

Substances