. 2008 Jun 5;112(22):6878-86.
doi: 10.1021/jp800282x. Epub 2008 May 10.

A test on peptide stability of AMBER force fields with implicit solvation

Affiliations

A test on peptide stability of AMBER force fields with implicit solvation

M Scott Shell et al. J Phys Chem B. .

Abstract

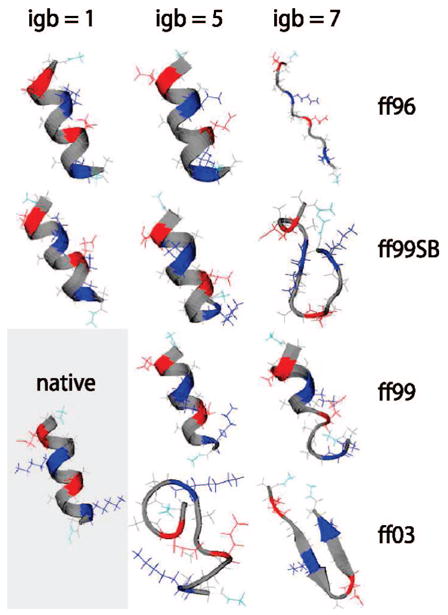
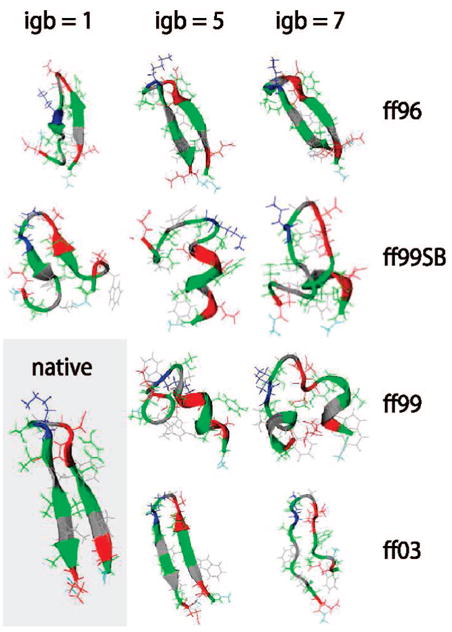
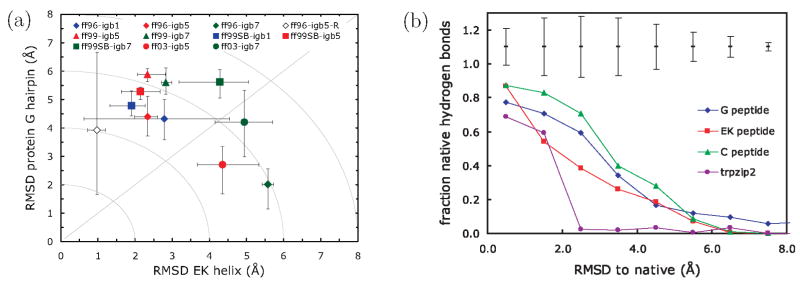
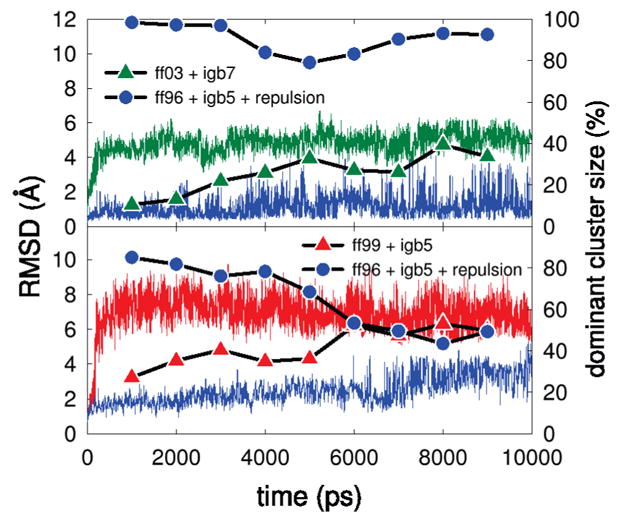
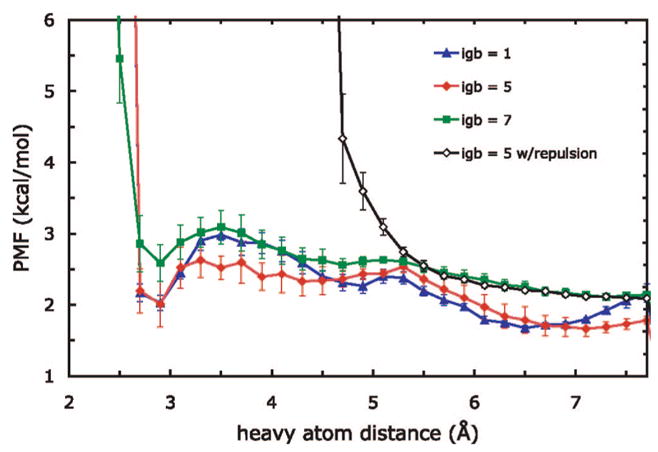
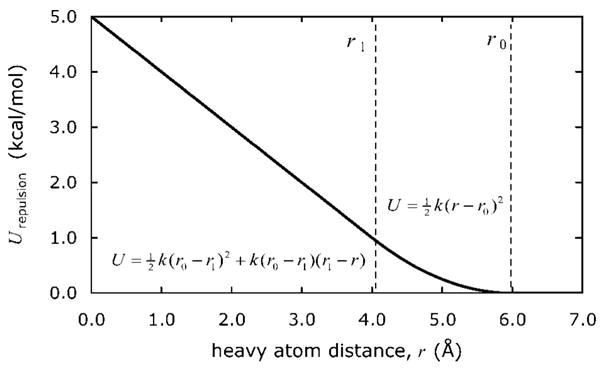
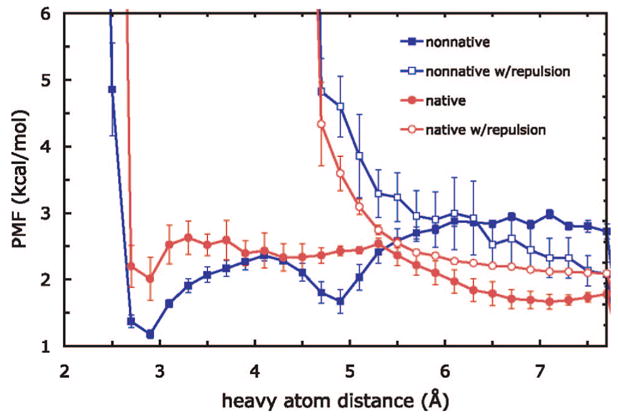
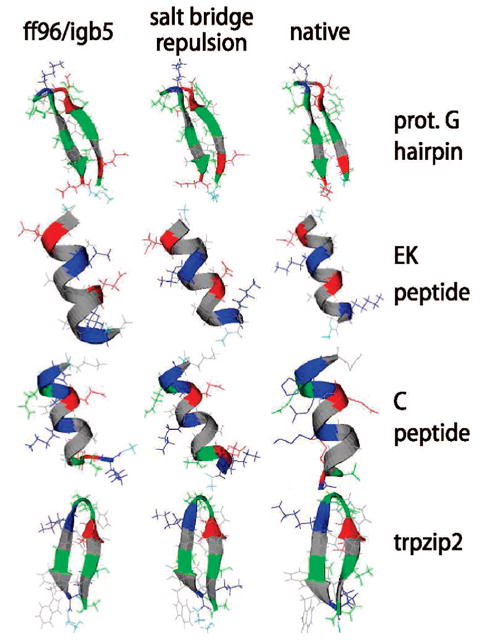
We used replica exchange molecular dynamics (REMD) simulations to evaluate four different AMBER force fields and three different implicit solvent models. Our aim was to determine if these physics-based models captured the correct secondary structures of two alpha-helical and two beta-peptides: the 14-mer EK helix of Baldwin and co-workers, the C-terminal helix of ribonuclease, the 16-mer C-terminal hairpin of protein G, and the trpzip2 miniprotein. The different models gave different results, but generally we found that AMBER ff96 plus the implicit solvent model of Onufriev, Bashford, and Case gave reasonable structures, and is fairly well-balanced between helix and sheet. We also observed differences in the strength of ion pairing in the solvent models, we but found that the native secondary structures were retained even when salt bridges were prevented in the conformational sampling. Overall, this work indicates that some of these all-atom physics-based force fields may be good starting points for protein folding and protein structure prediction.


Figures

Figure 1
Figure 1
Top cluster conformations for the EK peptide from replica exchange simulations. The conformation with the most secondary structure among the dominant clusters of the three repeat runs for each force field/solvent combination is shown. Colors are residue-specific: gray, hydrophobic; green, polar; red, negatively charged; blue, positively charged. The presumed native configuration is shown at the bottom left. The solvent model igb1 was not tested with ff99 and ff03.
Figure 2
Figure 2
Top cluster conformations for the protein G hairpin from replica exchange simulations. See Figure 1 for further details.
Figure 3
Figure 3
(left) Double-error plot of average backbone rmsd for the EK peptide and G hairpin for the last 1 ns of the 10 ns REMD simulations. The points represent the average over three independent REMD runs; the error bars show the maximum and minimum averaged rmsd’s among the three runs. Colors denote the solvent model (blue, igb1; red, igb5; green, igb7) and symbols indicate the force field (diamonds, ff96; triangles, ff99; squares, ff99SB; circles, ff03). The hollow diamond indicates the result for the modified ff96/igb5 runs using the salt bridge prevention sampling protocol (see text). Gray lines serve as a guide to the eye. (right) Comparison of average rmsd values to the average fraction of native backbone hydrogen bonds formed. For clarity, bars giving the standard deviations over the data set of the calculation are placed above the curves.
Figure 4
Figure 4
Comparison of simulation progress between the best- and worst-performing force fields. The top panel corresponds to the EK peptide and the bottom to the protein G hairpin. Continuous thin lines depict the rmsd to the presumed native structure, whereas points and thick lines indicate the populations of the dominant configurational clusters in a 2000 ns window centered around the indicated time.
Figure 5
Figure 5
Potential of mean force between native ion-pairing side-chain atoms in the protein G hairpin. The distance is calculated between the charged N in Lys7 and one charged O in Asp10; the two PMFs for each of the aspartate oxygens are averaged. The PMFs were aligned such that the exponential of −1/kBT times their value is proportional to the fraction of simulation time spent in the corresponding distance bin. Error bars shown are computed over the two aspartate oxygens and three run trials.
Figure 6
Figure 6
Repulsive energy function used between potential ion-pairing heavy atoms to prevent salt-bridge formation. Decreasing from large distances, the potential is zero until r0, harmonic with a force constant k until r1, and continuously linear thereafter. We used r0 = 6 Å, r1 = 4 Å, and k = 0.5 kcal/mol.
Figure 7
Figure 7
Comparison of salt-bridge interactions in the protein G hairpin for ff96 + igb5 with and without the salt-bridge-free sampling (using a repulsive potential to prevent salt bridges). The native interaction is Lys7–Asp10, while the non-native is Lys7–Asp11.
Figure 8
Figure 8
Top cluster conformations for four peptides from replica exchange simulations using the best-performing force field/solvent pair, 96 + igb5. The conformation with the most secondary structure among the dominant clusters of the three repeat runs for each scenario is shown. Colors are identical to those in previous figures.

References

    1. Brooks BR, Bruccoleri RE, Olafson BD, States DJ, Swaminathan S, Karplus M. J Comput Chem. 1983;4:187.
    1. Pearlman DA, Case DA, Caldwell JW, Ross WS, Cheatham TE, III, Debolt S, Ferguson D, Seibel G, Kollman P. Comput Phys Commun. 1995;91:1.
    1. Case DA, Cheatham TE, Darden T, Gohlke H, Luo R, Merz KM, Onufriev A, Simmerling C, Wang B, Woods RJ. J Comput Chem. 2005;26:1668. - PMC - PubMed
    1. Jorgensen WL, Tirado-Rives J. J Am Chem Soc. 1988;110:1657. - PubMed
    1. Duan Y, Kollman PA. Science. 1998;282:740. - PubMed

Publication types