. 2008 Aug;163(2):117-26.
doi: 10.1016/j.jsb.2008.03.011. Epub 2008 Apr 4.

Myosin filament 3D structure in mammalian cardiac muscle

Affiliations

Myosin filament 3D structure in mammalian cardiac muscle

Hind A Al-Khayat et al. J Struct Biol. 2008 Aug.

Abstract

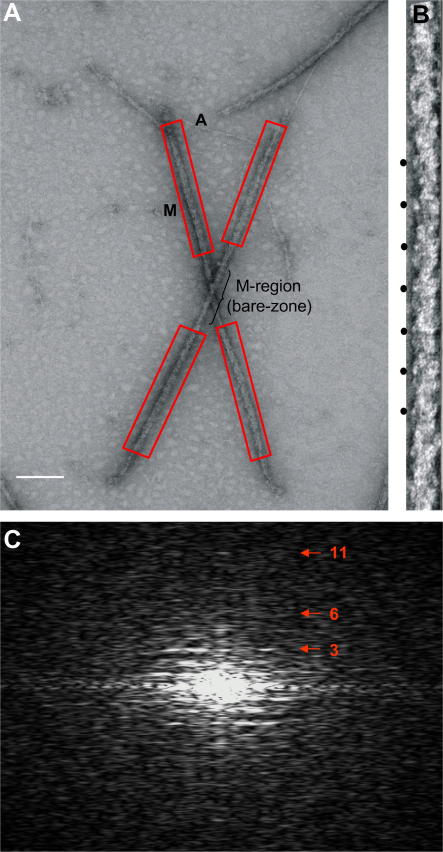
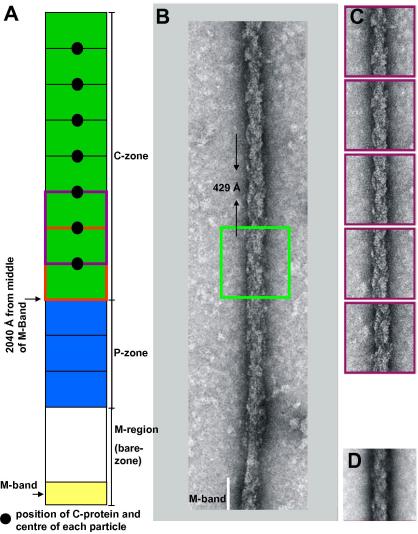
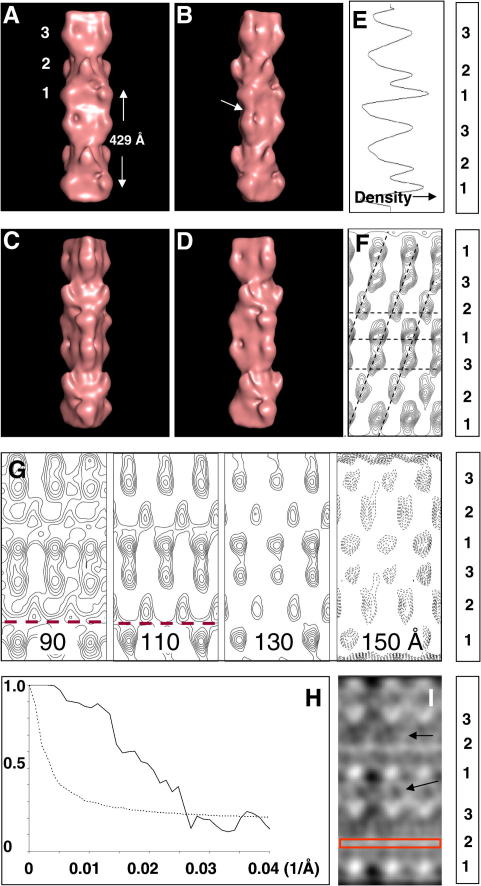
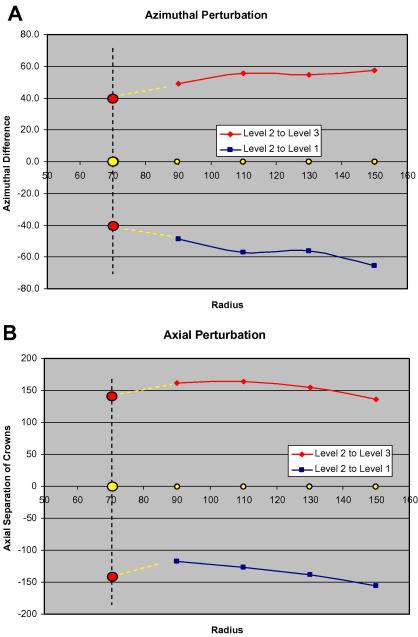
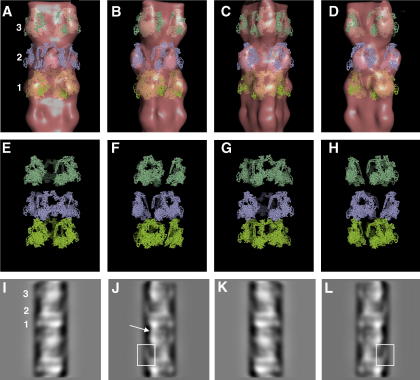
A number of cardiac myopathies (e.g. familial hypertrophic cardiomyopathy and dilated cardiomyopathy) are linked to mutations in cardiac muscle myosin filament proteins, including myosin and myosin binding protein C (MyBP-C). To understand the myopathies it is necessary to know the normal 3D structure of these filaments. We have carried out 3D single particle analysis of electron micrograph images of negatively stained isolated myosin filaments from rabbit cardiac muscle. Single filament images were aligned and divided into segments about 2x430A long, each of which was treated as an independent 'particle'. The resulting 40A resolution 3D reconstruction showed both axial and azimuthal (no radial) myosin head perturbations within the 430A repeat, with successive crown rotations of approximately 60 degrees , 60 degrees and 0 degrees , rather than the regular 40 degrees for an unperturbed helix. However, it is shown that the projecting density peaks appear to start at low radius from origins closer to those expected for an unperturbed helical filament, and that the azimuthal perturbation especially increases with radius. The head arrangements in rabbit cardiac myosin filaments are very similar to those in fish skeletal muscle myosin filaments, suggesting a possible general structural theme for myosin filaments in all vertebrate striated muscles (skeletal and cardiac).


Figures

Fig. 1
Fig. 1
(A) Overview electron micrograph of isolated myosin filaments (M) from the ventricular muscle of normal rabbit heart in the relaxed state, viewed in negative stain over a hole in the support film. Some actin filaments (A) can be seen in the background. The helical arrays of myosin heads are evident in each half of the bipolar myosin filaments (scale bar 2000 Å). (B) Typical half-filament selected from the micrograph such as in (A), shown with the M-region (bare-zone) towards the bottom and showing the characteristic 430 Å axial repeat (black circles). (C) Calculated Fourier transforms of the half-filament shown in (B). Orders of the 430 Å repeat are shown in red numbers. The spacing of the sixth order of the 430 Å repeat, the 71.5 Å meridional reflection, was used to calibrate the magnification and to adjust the sampling of each half-filament from all the different micrographs to be exactly 7.54 Å/pixel. This sixth order meridional reflection was particularly strong in most of the Fourier transforms. The 11th order of the 430 Å repeat corresponding to 39 Å resolution (the titin sub-repeat) is also visible.
Fig. 2
Fig. 2
(A) Schematic diagram showing the different A-band regions within the myosin half-filament as defined by Sjostrom and Squire (1977a, 1977b) starting with the half M-band at the bottom, then the half bare-zone (M-region), the P-zone and the C-zone. Particles were selected from the C-zone only, each particle being just over 2 × 430 Å repeats long and with a C-protein stripe (maroon circle) in the middle. (B) Half-filament oriented with the M-region (bare-zone) at the bottom. The first particle was selected at the position shown by a green square of size 128 pixels, equivalent to just over 2 × 430 Å, and whose edge was at a distance 2040 Å from the middle of the M-band. (C) Some of the seven successive boxed segments each of length 128 pixels selected by stepping along the single half-filament in (A) at 430 Å intervals. (D) The average sum of the seven particles some of which are shown in (C).
Fig. 3
Fig. 3
(A–D) Surface views of 3D reconstructions of the rabbit myosin filament obtained by the single-particle EM analysis and displayed using PyMOL (DeLano, 2002). The reconstruction is shown in four views at different angles around the filament long axis (in steps of 30°) to illustrate the different crown structures; (A) view with the myosin heads on the second crown facing the viewer and (C) view with the myosin heads on the first and third crowns facing the viewer. Note that the two views in (A) and (C) are quite distinct because of the different perturbations in the crowns. The arrow in (B) points to longitudinal density connecting the projected myosin head masses on levels 3 and 1. (E) 1D density profile of the maps shown in (A–D) illustrating the strong density, presumed to be C-protein, on crown 1. (F) Circumferential section at a radius of 110 Å from the filament axis in the fish EM reconstruction of AL-Khayat et al. (2006) shown as a contour plot. (G) Circumferential sections at radii of 90, 110, 130 and 150 Å from the filament axis in the current rabbit EM reconstruction (as in (A–D)), shown as contour plots. There is a weak circumferential density (dashed red lines) just above level 1. (H) Estimation of the resolution of the reconstruction using a Fourier Shell Correlation plot (solid line) obtained by comparing two independent reconstructions each representing half the dataset of the final 3D map compared with the half-bit curve (dashed line) according to the definitions of van Heel and Schatz (2005). The intercept between the two curves is at about 38.6 Å. (I) Circumferential section at a radius of 75 Å from the filament axis in the current rabbit EM reconstruction (as in (A–D)), shown here as a density. The red box points to density above crown 1 as in the dashed lines of G. The arrows point to a network of densities in the regions between the positions of the myosin heads masses on crowns 1 and 3 and 2 and 3 that could be attributable to myosin rod mass, C-protein and/or titin. All views in (A) to (G) and (I) are with the M-band towards the bottom and crown numbers labelled on the panels to the right.
Fig. 4
Fig. 4
The azimuthal (A) and axial (B) perturbations measured relative to level 2 and plotted as a function of radius from the filament axis. The red circles show the expected start positions if the myosin head origins are on a perfect helix. The yellow circles show the crown 2 level used as a comparison (i.e. zero difference from itself). The yellow dashed lines shows the way in which the perturbations between levels 2 and 1 and 2 and 3 would need to change for the head origins to be on a perfect helix. In (A) the azimuthal perturbation appears to be tracking back towards the 40° for a perfect helix. In (B) the level 2 to level 3 axial difference starts around 140 Å at high radius, increases away from this as the radius reduces, but then appears to be coming back towards the perfect helix value (143.4 Å) at lower radius. On the other hand the axial perturbation between levels 2 and 1 appears to be consistently reducing towards lower radii. Further low radius data at higher resolution will be required to see if this perturbation also returns to 143.4 Å.
Fig. 5
Fig. 5
(A–D) The best fit of Wendt et al. (2001) into the current EM map viewed at four different angles around the filaments long axis (in steps of 30°) as in Fig. 3(A–D) displayed using PyMOL (DeLano, 2002). (E–H) The fitted Wendt structure shown without the 3D map to reveal the detailed differences in head orientations on each crown. (I–L) 2D projections of the 3D map projected at the same angle of views shown in Fig. 3(A–D). The levels are numbered in the same way as in Fig. 3. See text for arrows and boxes.

References

    1. Aksoy M.O., Williams D., Sharkey E.M., Hartshorne D.J. A relationship between Ca2+ sensitivity and phosphorylation of gizzard actomyosin. Biochem. Biophys. Res. Commun. 1976;69:35–41. - PubMed
    1. AL-Khayat H.A., Hudson L., Reedy M.K., Irving T.C., Squire J.M. Myosin head configuration in relaxed insect flight muscle: X-ray modelled resting cross-bridges in a pre-powerstroke state are poised for actin binding. Biophys. J. 2003;85(2):1063–1079. - PMC - PubMed
    1. AL-Khayat H.A., Morris E.P., Squire J.M. Single particle analysis: a new approach to solving the 3D structure of myosin filaments. Review. J. Muscle Res. Cell Motil. 2004;25(8):635–644. - PubMed
    1. AL-Khayat H.A., Squire J.M. Refined structure of bony fish muscle myosin filaments from low-angle X-ray diffraction Data. J. Struct. Biol. 2006;155:218–229. - PubMed
    1. AL-Khayat H.A., Morris E.P., Kensler R.W., Squire J.M. 3D structure of fish muscle myosin filaments by single particle analysis. J. Struct. Biol. 2006;155:202–217. - PubMed

Publication types

Substances

LinkOut - more resources