

Individual patient diagnosis of AD and FTD via high-dimensional pattern classification of MRI
- PMID: 18474436
- PMCID: PMC2528893
- DOI: 10.1016/j.neuroimage.2008.03.050
Individual patient diagnosis of AD and FTD via high-dimensional pattern classification of MRI
Abstract
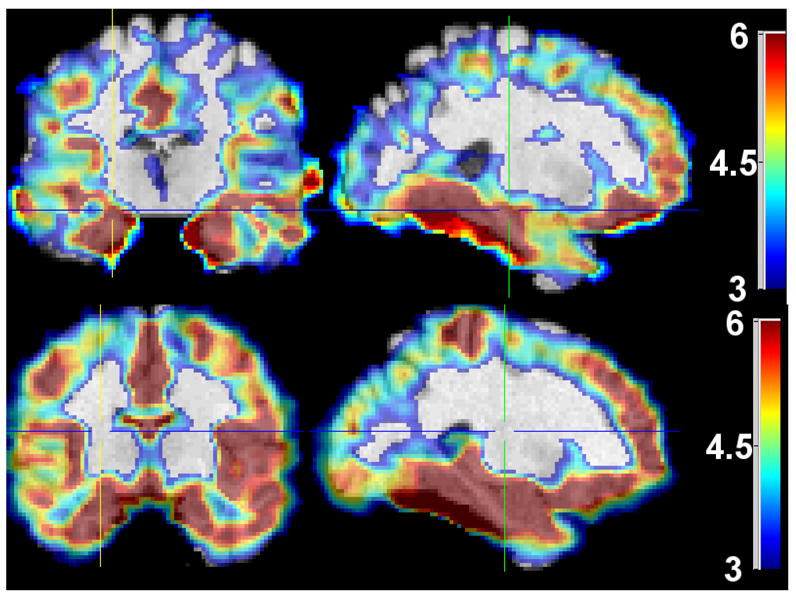
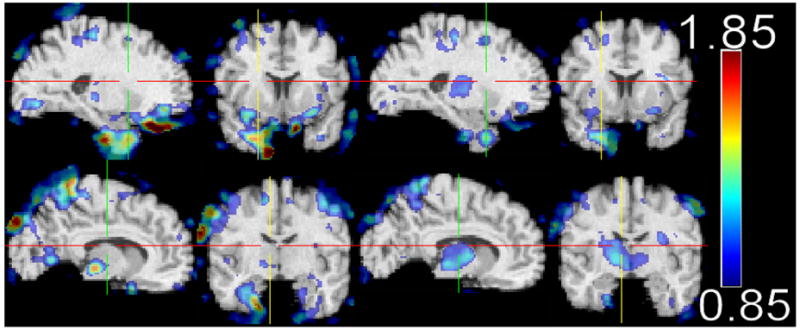
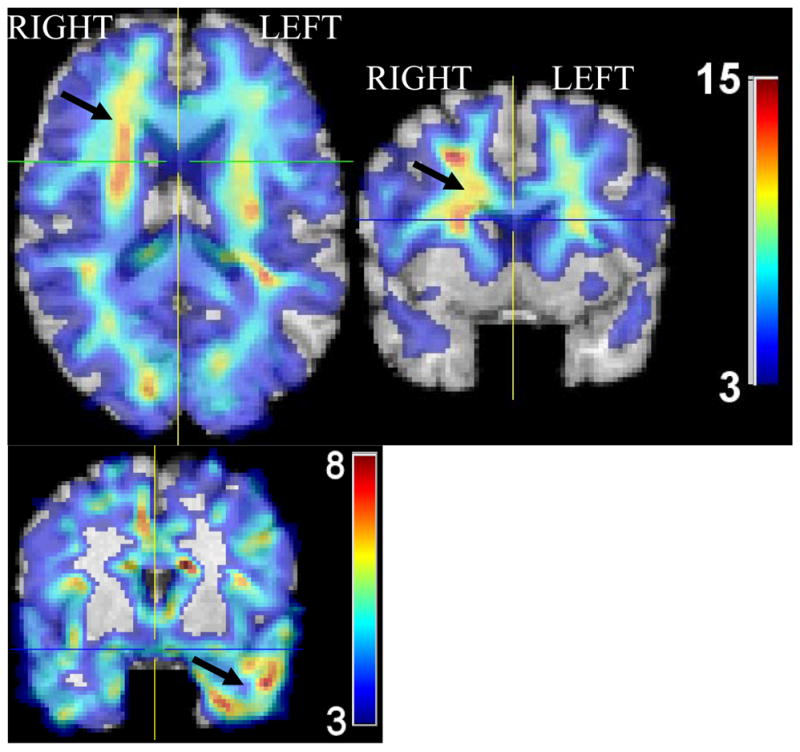
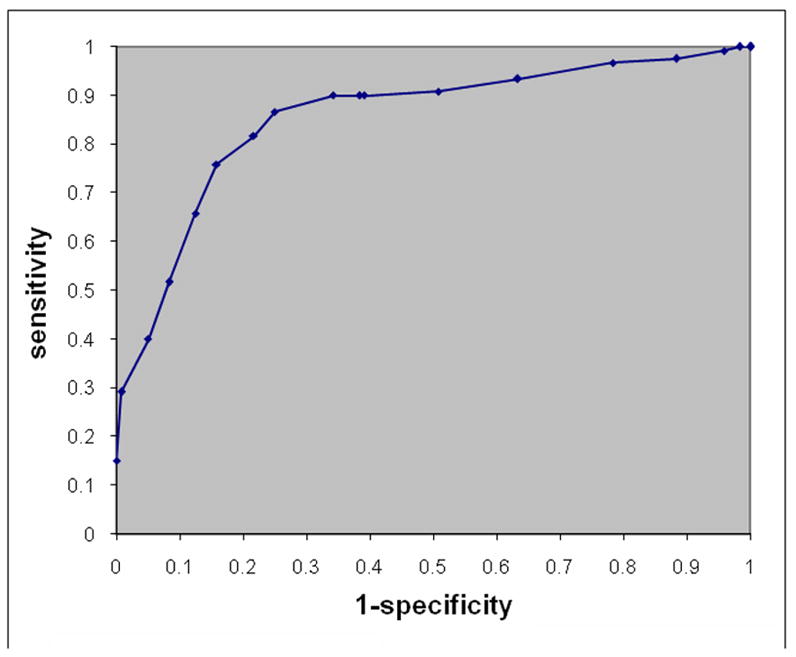
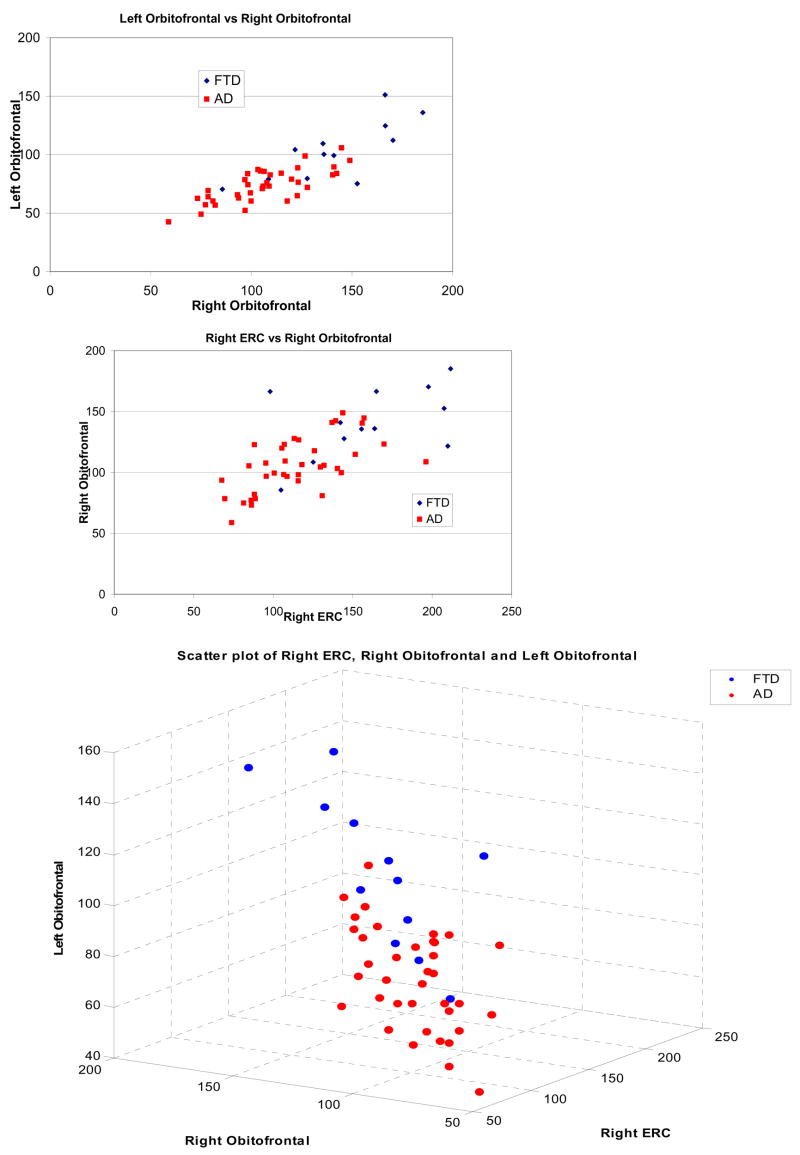
The purpose of this study is to determine the diagnostic accuracy of MRI-based high-dimensional pattern classification in differentiating between patients with Alzheimer's disease (AD), Frontotemporal Dementia (FTD), and healthy controls, on an individual patient basis. MRI scans of 37 patients with AD and 37 age-matched cognitively normal elderly individuals, as well as 12 patients with FTD and 12 age-matched cognitively normal elderly individuals, were analyzed using voxel-based analysis and high-dimensional pattern classification. Diagnostic sensitivity and specificity of spatial patterns of regional brain atrophy found to be characteristic of AD and FTD were determined via cross-validation and via split-sample methods. Complex spatial patterns of relatively reduced brain volumes were identified, including temporal, orbitofrontal, parietal and cingulate regions, which were predominantly characteristic of either AD or FTD. These patterns provided 100% diagnostic accuracy, when used to separate AD or FTD from healthy controls. The ability to correctly distinguish AD from FTD averaged 84.3%. All estimates of diagnostic accuracy were determined via cross-validation. In conclusion, AD- and FTD-specific patterns of brain atrophy can be detected with high accuracy using high-dimensional pattern classification of MRI scans obtained in a typical clinical setting.
Conflict of interest statement
Disclosure: The authors report no conflicts of interest.
Figures

References
-
- Ashburner J, Csernansky JG, et al. Computer-assisted imaging to assess brain structure in healthy and diseased brains. The Lancet (Neurology) 2003;2(2):79–88. - PubMed
-
- Barnes J, Whitwell JL, et al. Measurements of the Amygdala and Hippocampus in Pathologically Confirmed Alzheimer Disease and Frontotemporal Lobar Degeneration. Archives of Neurology. 2006;63(10):1434–1439. - PubMed
-
- Bobinski M, de Leon MJ, et al. MRI of entorhinal cortex in mild Alzheimer’s disease. Lancet. 1999;353(9146):38–40. - PubMed
-
- Braak H, Braak E, et al. Evolution of Alzheimer’s disease related cortical lesions. Journal of Neural Transmission Supplementum. 1998;54:97–106. - PubMed
-
- Chang JL, Lomen-Hoerth C, et al. A voxel-based morphometry study of patterns of brain atrophy in ALS and ALS/FTLD. Neurology. 2005;65(1):75–80. - PubMed
Publication types
MeSH terms
Grants and funding
LinkOut - more resources
Full Text Sources
Medical
