. 2008 Aug;7(8):1570-83.
doi: 10.1074/mcp.M700545-MCP200. Epub 2008 May 12.

Amyloidogenic and associated proteins in systemic amyloidosis proteome of adipose tissue

Affiliations

Amyloidogenic and associated proteins in systemic amyloidosis proteome of adipose tissue

Francesca Lavatelli et al. Mol Cell Proteomics. 2008 Aug.

Abstract

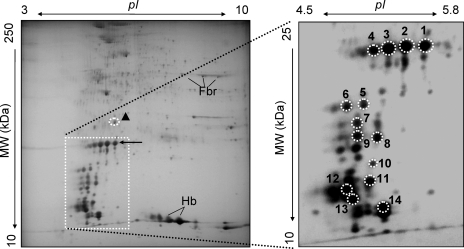
In systemic amyloidoses, widespread deposition of protein as amyloid causes severe organ dysfunction. It is necessary to discriminate among the different forms of amyloid to design an appropriate therapeutic strategy. We developed a proteomics methodology utilizing two-dimensional polyacrylamide gel electrophoresis followed by matrix-assisted laser desorption/ionization mass spectrometry and peptide mass fingerprinting to directly characterize amyloid deposits in abdominal subcutaneous fat obtained by fine needle aspiration from patients diagnosed as having amyloidoses typed as immunoglobulin light chain or transthyretin. Striking differences in the two-dimensional gel proteomes of adipose tissue were observed between controls and patients and between the two types of patients with distinct, additional spots present in the patient specimens that could be assigned as the amyloidogenic proteins in full-length and truncated forms. In patients heterozygotic for transthyretin mutations, wild-type peptides and peptides containing amyloidogenic transthyretin variants were isolated in roughly equal amounts from the same protein spots, indicative of incorporation of both species into the deposits. Furthermore novel spots unrelated to the amyloidogenic proteins appeared in patient samples; some of these were identified as isoforms of serum amyloid P and apolipoprotein E, proteins that have been described previously to be associated with amyloid deposits. Finally changes in the normal expression pattern of resident adipose proteins, such as down-regulation of alphaB-crystallin, peroxiredoxin 6, and aldo-keto reductase I, were observed in apparent association with the presence of amyloid, although their levels did not strictly correlate with the grade of amyloid deposition. This proteomics approach not only provides a way to detect and unambiguously type the deposits in abdominal subcutaneous fat aspirates from patients with amyloidoses but it may also have the capability to generate new insights into the mechanism of the diseases by identifying novel proteins or protein post-translational modifications associated with amyloid infiltration.


Figures

F<sc>ig</sc>. 1.
Fig. 1.
The 2D PAGE proteome of abdominal subcutaneous fat tissue from control samples. Adipose tissue from normal, non-amyloid patients was subjected to plasma removal, dissolution in IEF buffer, delipidation, reduction and alkylation, and 2D PAGE analysis followed by Coomassie or silver staining as described in the text. Shown is a representative example of a silver-stained gel from a control sample (30 μg); the pI range is 3–10, and the molecular mass range is 10–250 kDa. The identities of landmark spots numbered 114 (circled) were assigned on the basis of in-gel digestion, MALDI-TOF MS, and peptide mass fingerprint analyses; the assignments of these spots are indicated in Table I.
F<sc>ig</sc>. 2.
Fig. 2.
The 2D PAGE proteome of abdominal subcutaneous fat tissue from AL patient 05-141. Adipose tissue aspirates from patients with Ig light chain amyloidosis were processed and subjected to 2D PAGE analysis and silver staining similarly to control samples. Shown here is a representative example of a gel from a sample (25 μg) from patient 05-141. The pI range is 3–10, and the molecular mass range is 10–250 kDa (left panel). In the enlargement of the boxed region of this gel (pI range, 4.5–5.8; molecular mass range, 10–25 kDa; shown in the right panel) are contained the majority of novel spots relative to controls. The arrow indicates a train of spots at ∼25 kDa. The spots numbered 1–14 were excised and subjected to in-gel digestion, MALDI-TOF MS, and PMF analyses (spectra from spot numbers 1, 8, and 12 are shown in Fig. 3). All numbered spots were determined to have been derived from the patient's amyloidogenic immunoglobulin light chain. The ▴ symbol indicates a spot that was assigned on the basis of MS and PMF analyses as an amyloid-associated protein, apolipoprotein E; this spot also showed increased staining relative to controls. Fbr and Hb indicate the location of fibrin and hemoglobin subunit species, respectively.
F<sc>ig</sc>. 3.
Fig. 3.
MALDI-TOF MS characterization of Ig light chain species in the fat tissue 2D proteome of AL patient 05-141. All numbered spots shown in Fig. 2 were subjected to in-gel digestion and MALDI-TOF MS analysis as described. Shown are the aligned spectra of peptides derived from spot numbers 1, 8, and 12 over the range m/z 700–3000. Major peptide ions in the spectrum from spot number 1 are labeled with observed m/z values and the corresponding amino acid intervals (bold) as assigned by PMF analysis and by comparison with theoretical values calculated from the cDNA-derived immunoglobulin light chain sequence obtained from the patient's plasma cell clone (shown above the spectra). Peptide ions displaying oxidation (+Ox), sodium adduction (+Na), and water loss (−H2O) are indicated by arrows extending from the peaks corresponding to their unmodified forms. Total protein coverage represented by these peptide ions is shown underlined in the sequence above. Dotted lines between spectra indicate the stepwise disappearance of C-terminal peptide ions from the spectrum for spot number 1 as compared with the spectrum for spot number 8 and thence to the spectrum of spot number 12, consistent with progressive C-terminal truncation of the protein species through this series of spots. The minimal Ig light chain amino acid sequence suggested to be present in each spot by the detected peptides is indicated in parentheses below the spot number. T, trypsin autolysis peptide; aa, amino acids.
F<sc>ig</sc>. 4.
Fig. 4.
The 2D PAGE proteome of the abdominal subcutaneous fat tissue from ATTR patient 05-152 with the V122I mutation. Adipose tissue aspirates from patients with ATTR were processed and subjected to 2D PAGE analysis as described in the text. A shows a representative example of a silver-stained gel from a sample (25 μg) from patient 05-152. The pI range is 3–10, and the molecular mass range is 10–250 kDa. The boxed region designates the area of the gel that exhibits pronounced differences from control gels. The spots numbered 1–11 were excised and subjected to in-gel digestion, MALDI-TOF MS, and PMF analyses (the spectrum from spot number 1 is shown in Fig. 5). All spots were determined to be derived from TTR. The additional novel spots, indicated with the ▴ and ▪ symbols, were identified as the amyloid-associated proteins apolipoprotein E and serum amyloid P, respectively. This same sample was analyzed by 2D PAGE followed by Western blotting with polyclonal anti-TTR antisera. B shows the boxed regions of the gel from A with the results of Western blotting with polyclonal anti-human TTR antisera. The pI range is 4.5–5.9, and the molecular mass range is 10–35 kDa. Immunoreactive spots correspond to the numbered spots in A.
F<sc>ig</sc>. 5.
Fig. 5.
MALDI-TOF MS characterization of wild-type and V122I variant TTR in the 2D SDS-PAGE proteome of an ATTR patient. All spots numbered on the 2D gel shown in Fig. 4 (2D PAGE analysis of a reduced and alkylated sample from patient 05-152) were subjected to in-gel digestion with trypsin and MALDI-TOF MS analysis as described. Shown is the mass spectrum of tryptic peptides derived from spot number 1 over the range m/z 500–3200. Major peptide ions are labeled with observed m/z values and the corresponding amino acid intervals (bold) as assigned by PMF analysis and by comparison with predicted values calculated from the genomic DNA-derived sequences for wild-type TTR and its V122I variant. Peptide ions displaying single (+Ox) and double (+2Ox) oxidation are indicated by arrows extending from the peaks assigned to their unmodified forms. Total protein coverage represented by these peptide ions is shown underlined in the TTR sequence above the spectrum. The wild-type and variant residues at position 122 are both indicated in bold. The inset shows an expansion of the spectrum over the range m/z 2480–2540. Wild-type and V122I variant peptide ion pairs, corresponding to TTR peptides 105–127 and 104–126 as indicated, are separated by a mutation-derived mass shift of +14 Da. Two additional pairs, corresponding to TTR peptides 105–126 and 104–127, are also designated. T, trypsin autolysis peptide; wt, wild type.
F<sc>ig</sc>. 6.
Fig. 6.
Disease-associated decreases observed in the expression of spots assigned to adipocyte proteins in patients with AL and ATTR amyloidoses. Details of regions of the 2D PAGE proteomes of abdominal subcutaneous fat tissue aspirates (as numerically coded in the upper left corner of each image) are shown in comparison with those from normal controls. After staining of the gel spots, image exposure levels were matched to the total non-amyloidogenic protein load and to the intensity of the non-amyloid-associated landmark spots. Circled spots, which demonstrated pronounced decreases in the staining intensity in the samples from most patients, were identified by in-gel digestion, MALDI-TOF MS, and PMF analyses. A, isoforms of αB-crystallin (αB-CRY) with approximate molecular mass of 22 kDa. B, peroxiredoxin 6 with approximate molecular mass of 25 kDa. C, aldo-keto reductase with approximate molecular mass of 37 kDa. LC, an amyloidogenic light chain spot from one patient (06-095) is visible in the detail.
F<sc>ig</sc>. 7.
Fig. 7.
2D PAGE analysis of the sera from patients with AL and TTR amyloidoses demonstrates the presence of the full-length, but not truncated, isoforms of the amyloidogenic precursors. Approximately 70 μl of matched serum samples were processed and subjected to 2D PAGE analysis as described. A shows a representative example of a silver-stained gel from AL patient 05-141, and B shows the gel from ATTR patient 05-152. The boxed areas in A and B correspond to the boxed regions of the gels displayed in Figs. 2 and 4, respectively. Circled spots were assigned on the basis of in-gel digestion followed by MALDI-TOF MS and PMF analyses of the proteolytic peptides. The data were compared with publicly available human plasma 2D reference maps (available from ExPASy) and proteomics databases. The protein in the spot indicated by the arrow in A was assigned on the basis of MS and PMF analyses as the patient's full-length Ig light chain. The spot aligned precisely with the spot at 25 kDa in the fat tissue analysis from the same patient that is indicated by an arrow in Fig. 2. Spots indicated by the arrows in B aligned with the two most basic spots in the train of spots at 13–14 kDa in the gel from this patient's fat tissue (indicated in Fig. 4 as spots number 1 and 2). 1, apolipoprotein A-I; 2, haptoglobin; 3, transthyretin. A sample equivalent to that in B was subjected 2D PAGE followed by Western analysis using polyclonal anti-human TTR antisera. C shows the region of this 2D Western blot corresponding to the boxed region in B. Arrows in C indicate immunoreactive spots corresponding to the silver-stained spots marked with arrows in B. The ▾ symbol indicates a weakly immunoreactive spot at ∼35 kDa.

References

    1. Merlini, G., and Bellotti, V. ( 2003) Molecular mechanisms of amyloidosis. N. Engl. J. Med. 349, 583–596 - PubMed
    1. Westermark, P., Benson, M. D., Buxbaum, J. N., Cohen, A. S., Frangione, B., Ikeda, S. I., Masters, C. L., Merlini, G., Saraiva, M. J., and Sipe, J. D. ( 2005) Amyloid: toward terminology clarification—report from the Nomenclature Committee of the International Society of Amyloidosis. Amyloid 12, 1–4 - PubMed
    1. Obici, L., Perfetti, V., Palladini, G., Moratti, R., and Merlini, G. ( 2005) Clinical aspects of systemic amyloid diseases. Biochim. Biophys. Acta 1753, 11–22 - PubMed
    1. Falk, R. H., Comenzo, R. L., and Skinner, M. ( 1997) Medical progress—the systemic amyloidoses. N. Engl. J. Med. 337, 898–909 - PubMed
    1. Picken, M. M. ( 2007) New insights into systemic amyloidosis: the importance of diagnosis of specific type. Curr. Opin. Nephrol. Hypertens. 16, 196–203 - PubMed

Publication types