. 2008 Jul 11;283(28):19714-29.
doi: 10.1074/jbc.M708703200. Epub 2008 May 12.

Hsf-1 and POB1 induce drug sensitivity and apoptosis by inhibiting Ralbp1

Affiliations

Hsf-1 and POB1 induce drug sensitivity and apoptosis by inhibiting Ralbp1

Sharad S Singhal et al. J Biol Chem. .

Abstract

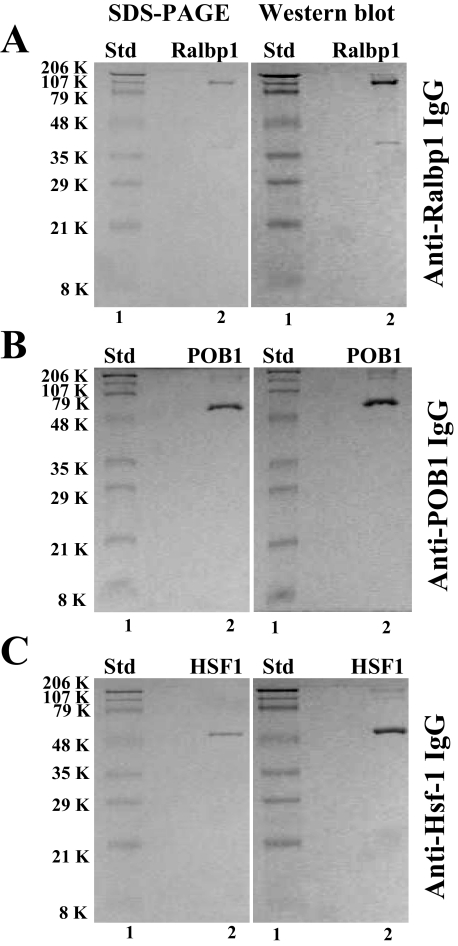
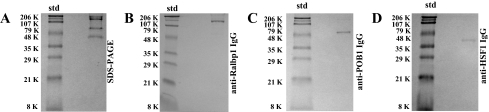
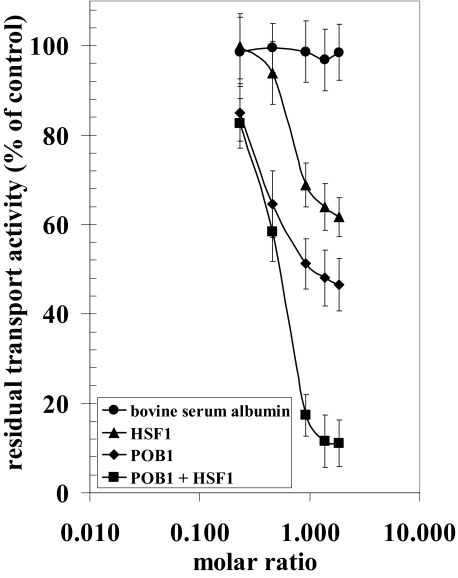
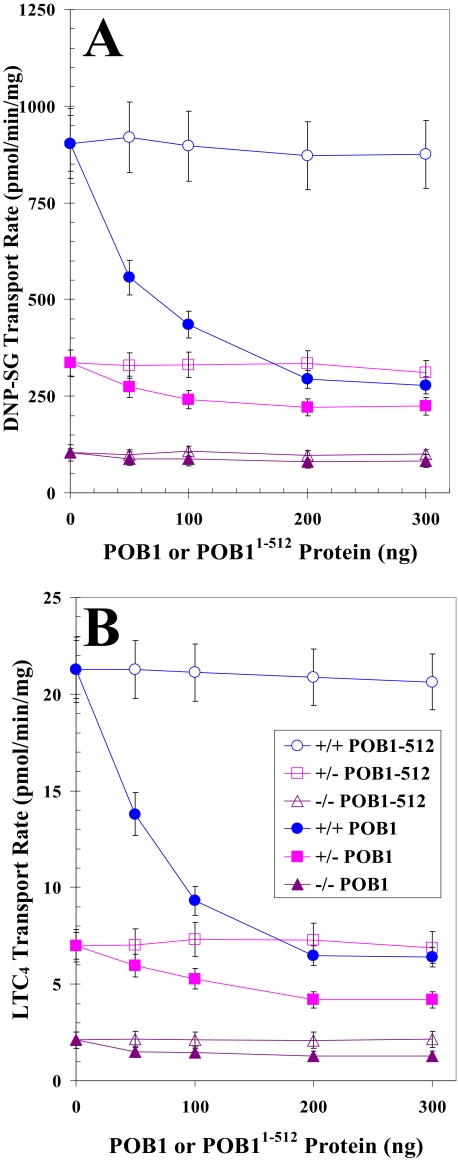
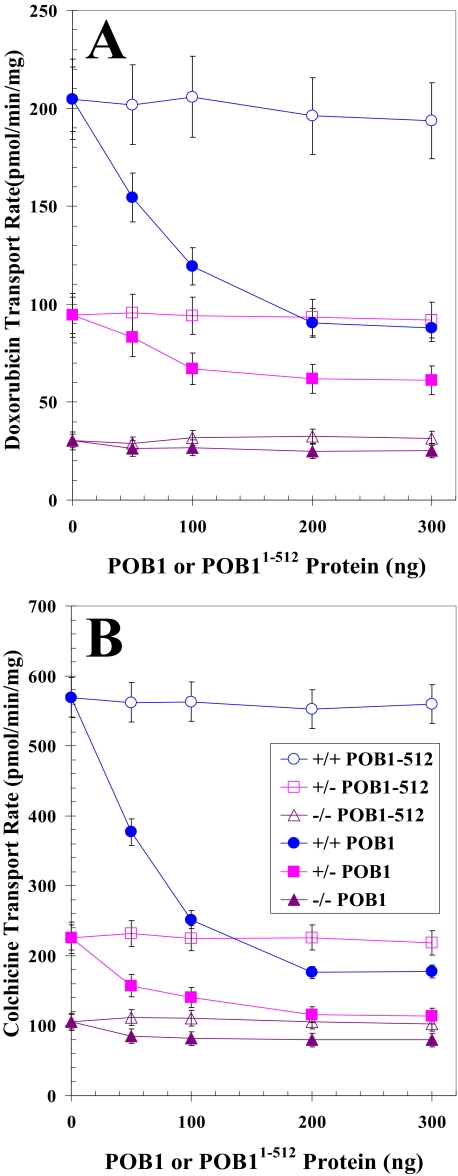
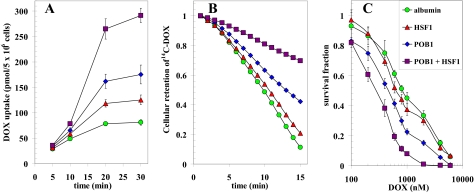
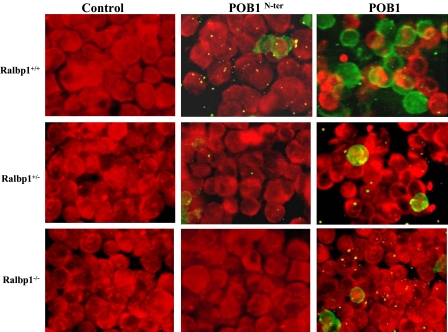
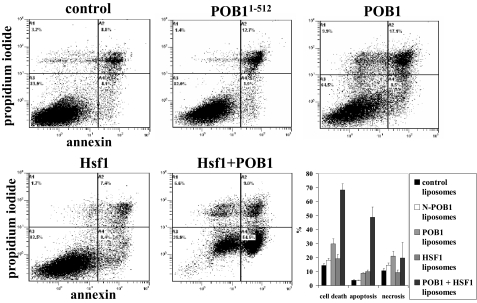
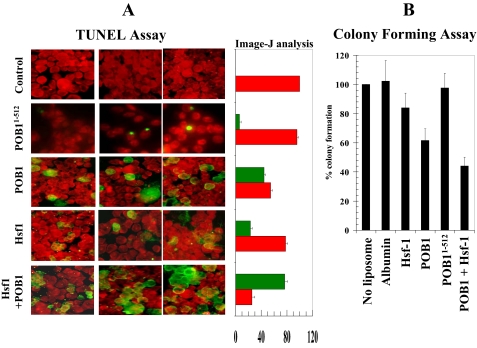
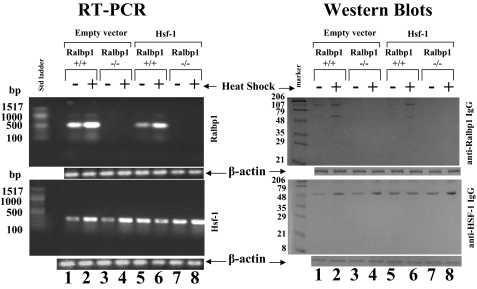
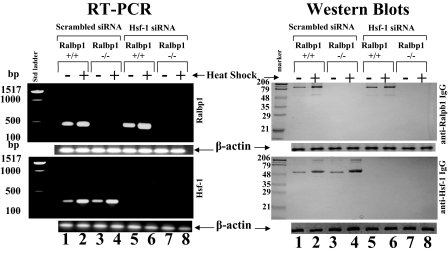
Hsf-1 (heat shock factor-1) is a transcription factor that is known to regulate cellular heat shock response through its binding with the multispecific transporter protein, Ralbp1. Results of present studies demonstrate that Hsf-1 causes specific and saturable inhibition of the transport activity of Ralbp1 and that the combination of Hsf-1 and POB1 causes nearly complete inhibition through specific bindings with Ralbp1. Augmentation of cellular levels of Hsf-1 and POB1 caused dramatic apoptosis in non-small cell lung cancer cell line H358 through Ralbp1 inhibition. These findings indicate a novel model for mutual regulation of Hsf-1 and Ralbp1 through Ralbp1-mediated sequestration of Hsf-1 in the cellular cytoskeleton and Hsf-1-mediated inhibition of the transport activity of membrane-bound Ralbp1.


Figures

FIGURE 1.
FIGURE 1.
Purity of recombinant human Ralbp1, POB1, and Hsf-1. DNPSG affinity-purified reconstituted Ralbp1 (5 μg) and Ni2+-nitrilotriacetic acid Superflow resin (Qiagen)-purified reconstituted POB1 (5 μg) and reconstituted Hsf-1 (5 μg) were applied to SDS-PAGE and subjected to Western blot analyses against rabbit-anti-Ralbp1 IgG (A), rabbit anti-POB1 IgG (B), and rabbit anti-Hsf-1 IgG (C). SDS-polyacrylamide gels were stained with Coomassie Brilliant Blue R250, and Western blots were developed using horseradish peroxidase-conjugated goat anti-rabbit IgG as secondary antibody. Std, standard.
FIGURE 2.
FIGURE 2.
Ternary complex formation between Ralbp1, Hsf-1, and POB1. Purified recombinant Ralbp1, POB1, and Hsf-1 proteins (10 μg each) were cross-linked by incubation with 0.1 mm SPDP in a total volume of 0.5 ml in 10 mm sodium phosphate buffer, pH 7.4, for 30 min. Excess SPDP was removed by passing the solution through a Sephadex G-50 spin column. Sample was treated with 0.5 mm N-ethylmaleimide for 10 min to block all free SH groups, and protein complexes were immunoprecipitated by incubating with anti-Ralbp1 IgG for 12 h, followed by protein A-Sepharose in radioimmune precipitation assay buffer for 2 h. Samples were sedimented by centrifugation at 10,000 × g and washed with radioimmune precipitation assay buffer and then resuspended in 100 μl of SDS-PAGE sample buffer. Cross-linked proteins were analyzed by SDS-PAGE (A), followed by Western blots against anti-Ralbp1 IgG (B), anti-POB1 IgG (C), and anti-Hsf-1 IgG (D). Std, standard.
FIGURE 3.
FIGURE 3.
Inhibition of the 14C-DOX transport in Ralbp1 liposomes by POB1 or Hsf-1. 14C-DOX transport activity was measured as ATP-dependent DOX uptake in artificial soybean-asolectin liposomes reconstituted with purified reconstituted Ralbp1 using established methods for quantifying 14C-DOX uptake by vesicles (8, 11). Controls included liposomes prepared without Ralbp1, liposomes prepared with heat-inactivated Ralbp1, and absence of ATP. Purified Hsf-1 and/or POB1 protein were added in varying molar ratios to the transport reaction mixture. Results presented are representative of three separate experiments, each with triplicate determinations.
FIGURE 4.
FIGURE 4.
Comparing POB1-mediated inhibition of glutathione conjugate efflux in Ralbp1+/+, Ralbp1+/-, or Ralbp1-/- MEFs. The transport activity of Ralbp1 toward DNP-SG (A) and LTC4 (B) was measured in crude membrane IOVs prepared from Ralbp1+/+ (circles), Ralbp1+/- (squares), and Ralbp1-/- (triangles) MEFs. The effect of full-length POB1 (closed symbols) or POB1-(1-512) (open symbols) at varying molar ratios was examined by including varying concentrations of these proteins in the transport medium. Transport medium contained IOV protein (20 μg/30 μl), 100 nm [3H]LTC4 (specific activity 1.5 × 10³ cpm/pmol), or 100 μm [3H]DNP-SG (specific activity 3.8 × 10³ cpm/nmol), without or with 4 mm ATP (three experiments, each in triplicate; n = 9). Heat-inactivated POB1 protein was also used for additional control.
FIGURE 5.
FIGURE 5.
Comparing POB1-mediated inhibition of drug efflux in Ralbp1+/+, Ralbp1+/-, or Ralbp1-/- MEFs. The transport activity of Ralbp 1 toward DOX(A) and COL (B) was measured in crude membrane IOVs prepared from Ralbp1+/+ (circles), Ralbp1+/- (squares), and Ralbp1-/- (triangles) MEFs. The effect of full-length POB1 (closed symbols) or POB1-(1-512) (open symbols) at varying molar ratios was examined by including varying concentration of these proteins in the transport medium. Transport medium contained IOV protein (20 μg/30 μl), 3.6 μm 14C-DOX(specificactivity 8.7×10⁴cpm/nmol), or 5μm[3H]COL(specificactivity 1.3× 10⁴ cpm/nmol) without or with 4 mm ATP (three experiments, each in triplicate; n = 9). Heat-inactivated POB1 protein was also used for additional control.
FIGURE 6.
FIGURE 6.
Liposomal reconstitution and delivery of Ralbp1, POB1, and Hsf-1 in cells. Purified Hsf-1, Ralbp1, and POB1 proteins (5 μg/ml) were added to liposome vesiculation mixtures containing cholesterol/asolectin (1:4, w/w), and polidocanol. Vesiculation was started by the addition of SM-2 beads, which sequester polidocanol and cause formation of primarily unilamellar vesicles with a median diameter of 0.5 μm (22). The SM-2 beads were separated by centrifugation, and the supernatant fraction was applied to an ultracentrifuge at 104,000 × g for 1 h at 4 °C. The supernatant and pellet fractions were applied to SDS-PAGE, trans-blotted, and subjected to Western blot analysis against the respective antibody to determine the amount of each protein entrapped by liposomes (A-C, lanes 1 and 2, supernatant and pellet fractions, respectively). The proteoliposomes recovered from the pellet were diluted in buffer and added to cultured H358 cells (5 × 10⁶ cells) to a final protein concentration of 40 μg/ml. Shown are Western blot analyses comparing cells treated with control liposomes or proteoliposomes containing Hsf-1, POB1, or Ralbp1 (A-C, lanes 3 and 4, respectively) to determine whether cellular content of these proteins was increased after incubation with the respective proteoliposomes.
FIGURE 7.
FIGURE 7.
Effect of POB1 and Hsf-1 supplementation on DOX-cytotoxicity, uptake, and efflux. H358 NSCLC cells were treated with proteoliposomes containing 40 μg/ml albumin (green circles), Hsf-1 (red triangles), POB1 (blue diamonds), or both Hsf-1 and POB1 (purple squares). Uptake of 14C-DOX (specific activity 8.5 × 10⁴ cpm/nmol) by cells was determined by incubating the cells for varying periods of time with radiolabeled 14C-DOX and measuring radioactivity in the cell pellet (A). For efflux studies, cells were loaded with radiolabeled 14C-DOX for 60 min, followed by rapid dilution in 1 ml of buffer. Aliquots of the buffer were taken at 1-min intervals, and cellular drug content was calculated by back-addition from the residual DOX in cells at the end of the experiment (B) (11). The cytotoxic effects of DOX were measured by a 3-(4,5-dimethylthiazol-2-yl)-2,5-diphenyltetrazolium bromide assay 96 h after drug exposure (C) (26).
FIGURE 8.
FIGURE 8.
Loss of Ralbp1 results in loss of POB1-mediated apoptosis. The effect of POB1 overloading on apoptosis in MEFs was examined by a TUNEL assay. Ralbp1+/+, Ralbp1+/-, and Ralbp1-/- MEFs were grown on coverslips incubated with liposomes containing either no POB1, POB1-(1-512), or full-length POB1 (40 μg/ml final concentration) for 24 h prior to the TUNEL assay using a Promega fluorescence detection kit and examined using a Zeiss LSM 510 META (Germany) laser-scanning fluorescence microscope with filters of 520 and >620 nm. Photographs taken at identical exposure at ×400 magnification are presented. Apoptotic cells showed green fluorescence and characteristic of cell shrinkage.
FIGURE 9.
FIGURE 9.
Effect of Hsf-1 and POB1 on apoptosis and necrosis by flow cytometry. H358 cells (0.5 × 10⁶ cells/ml) were grown in a 6-well plate and were treated with control liposomes or liposomes reconstituted with 40 μg/ml (final concentration) recombinant Hsf-1, POB1, POB1-(1-512), or both (Hsf-1 and POB1) protein. After a 24-h incubation, the cells were harvested and centrifuged at 1500 × g for 5 min. Cells were washed once with PBS and resuspended in 400 μl of cold annexin binding buffer containing 5 μl of Annexin V-FITC and 5 μl of 0.1 mg/ml propidium iodide. Cells were incubated at room temperature for 10 min in the dark and were analyzed by flow cytometry using a Beckman Coulter Cytomics FC500 flow cytometer. Results were processed using CXP2.2 analysis software from Beckman Coulter.
FIGURE 10.
FIGURE 10.
Effect of POB1 and/or Hsf-1 on apoptosis and colony forming efficiency in H358 NSCLC cells. A, the effect of POB1 and Hsf-1 overloading on the TUNEL apoptosis assay. The H358 cells were grown on coverslips incubated for 24 h with control liposomes and proteoliposomes (40 μg/ml final concentration) containing either POB1-(1-512), POB1, Hsf-1, or both (POB1 + Hsf-1) for 24 h prior to the TUNEL assay using the Promega fluorescence detection kit and examined using a Zeiss LSM 510 META laser-scanning fluorescence microscope with filters of 520 and >620 nm. Photographs taken at identical exposure at ×400 magnification are presented. Apoptotic cells showed green fluorescence and characteristic of cell shrinkage. Data were also analyzed by Image-J, and results are presented in the adjacent bar diagram (live cells are red, and apoptotic cells are green). The colony-forming assay was performed by staining the cells with methylene blue, and the colonies were counted using an Innotech Alpha Imager (B). Values are means ± S.D. of three separate experiments.
FIGURE 11.
FIGURE 11.
Effect of Hsf-1 overexpression in Ralbp1+/+ and Ralbp1-/- MEFs. Ralbp1+/+ and Ralbp1-/- MEFs were cultured from fetal mice, as described previously (37), and all present studies were performed within the first six passages. Heat shock was applied by incubation of cells at 42 °C for 30 min, followed by a 2-h recovery period at 37 °C. Transient transfection of Hsf-1 was carried out using a pcDNA3.1 eukaryotic expression vector containing full-length Hsf-1 cDNA, and empty vector was used as control. Expression of mRNA in Ralbp1+/+ and Ralbp1-/- MEFs was evaluated by RT-PCR analysis. RNA was prepared by the RNeasy kit (Qiagen). For quantitative RT-PCR of Hsf-1, the forward primer was nt 337-348, and reverse primer was nt 635-655 (318-bp product). For Ralbp1, the forward primer was nt 1496-1515, and reverse primer was nt 1948-1968 (472-bp product). RT-PCR was performed using the Ready-to-use RT-PCR beads according to the manufacturer's instructions (Amersham Biosciences). For Western blot analyses, 200 μg of crude membrane homogenate protein was applied in each lane for SDS-PAGE, and after trans-blotting, Western blots were done using rabbit anti-human Ralbp1 polyclonal antibodies and rabbit anti-human Hsf-1 polyclonal antibodies. Secondary antibodies were goat anti-rabbit IgG peroxidase-conjugated. The blots were developed using 4-chloro-1-naphol as the chromogenic substrate. β-Actin was used as an internal control.
FIGURE 12.
FIGURE 12.
Effect of Hsf-1 depletion by siRNA in Ralbp1+/+ and Ralbp1-/- MEFs. Ralbp1+/+ and Ralbp1-/- MEFs were transfected with scrambled and Hsf-1 siRNA using the Lipofectamine 2000 reagent kit (Invitrogen). Expression of mRNA in Ralbp1+/+ and Ralbp1-/- MEFs was evaluated by RT-PCR analysis, and band intensities were checked by densitometry. RT-PCR was performed using Ralbp1 gene-specific primers (1496-1515 bp (upstream) and 1948-1968 (downstream)) (472-bp product) and Hsf-1 gene-specific primers (337-348 bp (upstream) and 635-655 (downstream)) (318-bp product). RT-PCR was performed using the Ready-to-use RT-PCR beads according to the manufacturer's instructions (Amersham Biosciences). Comparisons of Ralbp1 and Hsf-1 protein levels were performed by Western blot analyses. 200-μg aliquots of crude membrane extracts were applied to SDS-PAGE and Western blotting against Ralbp1 IgG and Hsf-1 IgG. Scanning densitometry was used to measure the intensities of the bands. β-Actin was used as an internal control.
FIGURE 13.
FIGURE 13.
Subcellular distribution of Ralbp1. The scheme used for fractionating cell homogenate from 1 × 10⁹ H358 cells into the nuclear (N), plasma membrane (PM), mitochondrial (MT), microsomal (MC), and cytosolic (C) fractions (27) is presented (A). Fractions were assayed for activity of lactate dehydrogenase (27), acetylcholinesterase (28), and carnitine acyltransferase (29) (B). The fractions (100 μg each) were subjected to SDS-PAGE, transblotted, and analyzed by Western blot for Ralbp1 as well as for histone-H3 and manganese-dependent superoxide dismutase (MnSOD) to demonstrate separation of nuclear and mitochondrial fractions, respectively (C). Std, standard.
FIGURE 14.
FIGURE 14.
Effect of heat shock on subcellular distribution of Ralbp1. The effect of heat shock (30 min at 42 °C, followed by a 2-h recovery at 37 °C) on Ralbp1 in each of the fractions is shown by Western blot analysis. Results were quantified by scanning densitometry (A). The cellular distributions of Ralbp1 were also analyzed by immunohistochemistry (B) using polyclonal anti-Ralbp1 antibodies without (top two panels) or with heat shock (bottom two panels). Std, standard.
FIGURE 15.
FIGURE 15.
Chromatin binding of Ralbp1 by ChIP assay. H358 cells (4.5 × 10⁷) were grown and fixed with 37% formaldehyde. Cells were scraped, and the chromatin was sheared by the protocol given under “Experimental Procedures.” The chromatin was immunoprecipitated using the negative control IgG, positive control IgG (provided by Active Motif), and anti-Ralbp1 IgG followed by binding with protein G beads. The chromatin was eluted from the protein G beads and was amplified by PCR using the control primers as well as negative control primers (provided by Active Motif) and Ralbp1 primers (forward primer, nt 1496-1515; reverse primer, nt 1948-1968), respectively. PCR products were quantified by running on 1% agarose gel. For heat shock experiments, the cells were exposed to 42 °C for 30 min, brought back to 37 °C, and allowed to recover for 2 h at 37 °C before fixing with 37% formaldehyde.

References

    1. Mivechi, N. F., Ouyang, H., and Hahn, G. M. (1992) Cancer Res. 52 6815-6822 - PubMed
    1. Inouye, S., Katsuki, K., Izu, H., Fujimoto, M., Sugahara, K., Yamada, S., Shinkai, Y., Oka, Y., Katoh, Y., and Nakai, A. (2003) Mol. Cell Biol. 23 5882-5895 - PMC - PubMed
    1. Shamovsky, I., Ivannikov, M., Kandal, E. S., Gershon, D., and Nudler, E. (2006) Nature 440 556-560 - PubMed
    1. Kabakov, A. E., Malyutina, Y. V., and Latchman, D. S. (2006) Radiation Res. 165 410-423 - PubMed
    1. Tanaka, K., Namba, T., Arai, Y., Fujimoto, M., Adachi, H., Sobue, G., Takeuchi, K., Nakai, A., and Mizushima, T. (2007) J. Biol. Chem. 282 23240-23252 - PubMed

Publication types

MeSH terms

Substances