. 2008 Aug;76(8):3374-89.
doi: 10.1128/IAI.00048-08. Epub 2008 May 12.

A genome-wide proteome array reveals a limited set of immunogens in natural infections of humans and white-footed mice with Borrelia burgdorferi

Affiliations

A genome-wide proteome array reveals a limited set of immunogens in natural infections of humans and white-footed mice with Borrelia burgdorferi

Alan G Barbour et al. Infect Immun. 2008 Aug.

Abstract

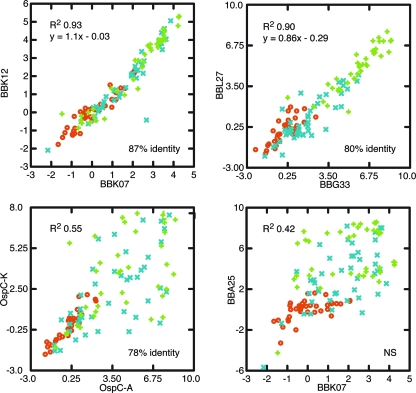
Humans and other animals with Lyme borreliosis produce antibodies to a number of components of the agent Borrelia burgdorferi, but a full accounting of the immunogens during natural infections has not been achieved. Employing a protein array produced in vitro from 1,292 DNA fragments representing approximately 80% of the genome, we compared the antibody reactivities of sera from patients with early or later Lyme borreliosis to the antibody reactivities of sera from controls. Overall, approximately 15% of the open reading frame (ORF) products (Orfs) of B. burgdorferi in the array detectably elicited an antibody response in humans with natural infections. Among the immunogens, 103 stood out on the basis of statistical criteria. The majority of these Orfs were also immunogenic with sera obtained from naturally infected Peromyscus leucopus mice, a major reservoir. The high-ranking set included several B. burgdorferi proteins hitherto unrecognized as immunogens, as well as several proteins that have been established as antigens. The high-ranking immunogens were more likely than nonreactive Orfs to have the following characteristics: (i) plasmid-encoded rather than chromosome-encoded proteins, (ii) a predicted lipoprotein, and (iii) a member of a paralogous family of proteins, notably the Bdr and Erp proteins. The newly discovered antigens included Orfs encoded by several ORFs of the lp36 linear plasmid, such as BBK07 and BBK19, and proteins of the flagellar apparatus, such as FliL. These results indicate that the majority of deduced proteins of B. burgdorferi do not elicit antibody responses during infection and that the limited sets of immunogens are similar for two different host species.


Figures

FIG. 1.
FIG. 1.
Overview of genome-wide proteome array results obtained with sera from humans with LB. The graphs are two sets of frequency histograms and scatter plots of binding of antibodies in panel 1 (upper panel) and panel 2 (lower panel) sera from controls and patients with early or later LB to an array of recombinant proteins produced in vitro from a total of 1,293 B. burgdorferi ORFs (1,292 ORFs from strain B31 and 1 ORF from strain 297). In the frequency histograms the x axes indicate relative log10 intensity values, and the y axes indicate the relative counts on an interval scale. In the scatter plots both the x and y axes indicate relative log10 intensity values. The distributions in the frequency histograms are indicated along with the medians of log10 intensity values with 95% confidence intervals. The scatter plots include two-sided P values obtained by using an exact Wilcoxon signed rank test. The data are shown in Tables S1 and S2 in the supplemental material.
FIG. 2.
FIG. 2.
Two-color display of a Euclidian distance cluster analysis of a small array with immunogenic Orfs of B. burgdorferi. The array was incubated with 12 sera from individuals with later LB (panel 1) or three control sera. In addition to selected Orfs from Table 1 the following three proteins were used: BB0383 (BmpA), BB0744 (P83/100), and BBA24 (DbpA). The Orf designations do not include “BB.” Protein names and hypothetical proteins (HP), as well as the PFs, are indicated on the right. Clusters are indicated on the left. The levels of bootstrap support (1,000 iterations) are as follows: orange, >50%; yellow, >60%; and black, 100%. A scale for log10 intensity values is at the bottom.
FIG. 3.
FIG. 3.
Scatter plots of array intensity values normalized in units of SDs above or below the mean for the controls of each panel. Each plot shows values for pairs of selected Orfs reacted with sera of controls (red circles) and patients with early LB (blue multiplication signs) or later LB (green plus signs) of panels 1 and 2. The coefficients of determination (R2) for all plots, as well as the linear regression equations for the upper two plots, are shown. The levels of identity of aligned amino acid sequences of the three pairs of homologous proteins are indicated; BBK07 and BBA25 are not significantly (NS) similar.
FIG. 4.
FIG. 4.
Western blot analysis of purified recombinant proteins encoded by ORFs BBA25 (DbpB), BBK12, BB279 (FliL), and BB283 (FlgE) incubated with sera of 17 patients with later LB or five panel 1controls. Binding of antibody was detected with alkaline phosphatase-labeled secondary antibody to human IgG as described in the text.
FIG. 5.
FIG. 5.
Binding of antibodies in human LB sera to purified proteins on arrays. The plots are box-whisker plots of log-transformed intensity values for the binding of panel 1 sera from patients with later LB (n = 17) or controls (n = 5) with purified recombinant proteins encoded by ORFs BBA25, BBG33, BBK12, and BB283 at concentrations of 0.03 mg/ml (red), 0.1 mg/ml (light blue), 0.3 (yellow), and 0.9 mg/ml (dark blue). Each box indicates the first and third quartiles, and the line inside the box is the median. The 1.5× interquartile range is indicated by the vertical line bisecting the box, and values outside this range are indicated by asterisks and by circles.
FIG. 6.
FIG. 6.
Western blot analysis of whole-cell lysates of low-passage and high-passage B. burgdorferi strain B31 with mouse antiserum to recombinant BBK12 or with murine monoclonal antibodies to BBA15 (OspA) or BB0147 (FlaB).
FIG. 7.
FIG. 7.
Estimation of the number of immunogens for assays with high sensitivity and specificity. The graphs show four receiver operating characteristic curves for nonlinear classifiers with different sets of Orfs and the effect of increasing the amounts of uniform Gaussian noise with a mean of 0 and an SD of 5, 10, 25, 75, or 150. The antigens in sets containing 2, 5, 25, and 45 antigens were selected in order of their ranking by the Bayes-regularized analysis (see Table S4 in the supplemental material). The solid lines indicate the average with standard error over cross-validation runs calculated at stepped (1 − specificity) points. The error bars indicate 95% confidence intervals. The dotted lines indicate the performance for each of 10 threefold cross-validation iterations.
FIG. A1.
FIG. A1.
Comparison of observed results with expected results from simulations: counts of Orfs in arrays with LB sera that were ≥3 SDs above the mean of control sera one or more times. Results for 39 panel 1 and 2 sera from patients with later LB are compared with mean counts (with 95% confidence intervals) for four simulation runs with random linkages. The numbers of Orfs that exceeded the 3-SD cutoff one to seven times are indicated next to the corresponding symbols for the random linkage simulation.

References

    1. Aguero-Rosenfeld, M. E., G. Wang, I. Schwartz, and G. P. Wormser. 2005. Diagnosis of lyme borreliosis. Clin. Microbiol. Rev. 18484-509. - PMC - PubMed
    1. Altman, D. G., D. Machin, T. N. Bryant, and M. J. Gardner. 2000. Statistics with confidence. BMJ Books, London, United Kingdom.
    1. Baldi, P., and H. G. Hatfield. 2002. DNA microarrays and gene expression: from experiments to data analysis and modeling. Cambridge University Press, Cambridge, United Kingdom.
    1. Baldi, P., and A. D. Long. 2001. A Bayesian framework for the analysis of microarray expression data: regularized t-test and statistical inferences of gene changes. Bioinformatics 17509-519. - PubMed
    1. Barbour, A. G. 1984. Immunochemical analysis of Lyme disease spirochetes. Yale J. Biol. Med. 57581-586. - PMC - PubMed

Publication types

MeSH terms