

Review
doi: 10.1021/cr078234p.
K+ channel modulators for the treatment of neurological disorders and autoimmune diseases
Affiliations
- PMID: 18476673
- PMCID: PMC2714671
- DOI: 10.1021/cr078234p
Item in Clipboard
Review
K+ channel modulators for the treatment of neurological disorders and autoimmune diseases
Chem Rev.
2008 May.
No abstract available
Figures
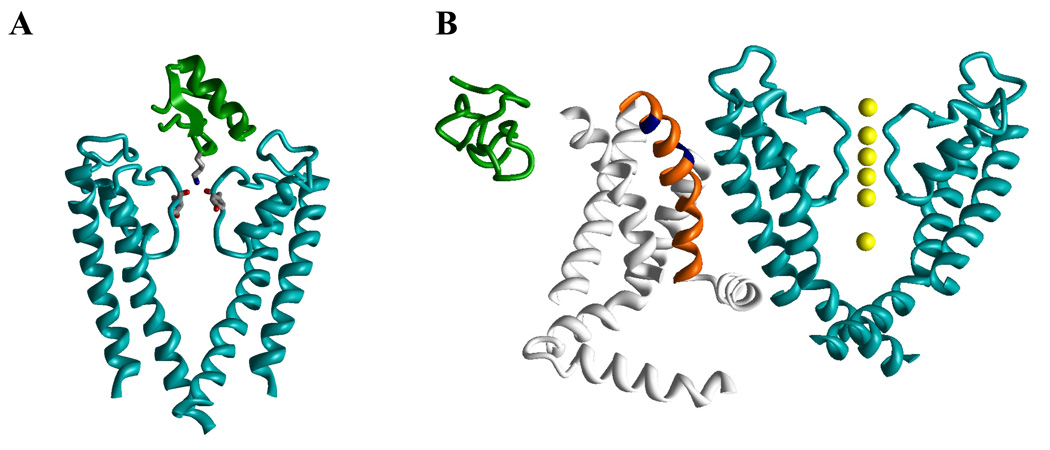
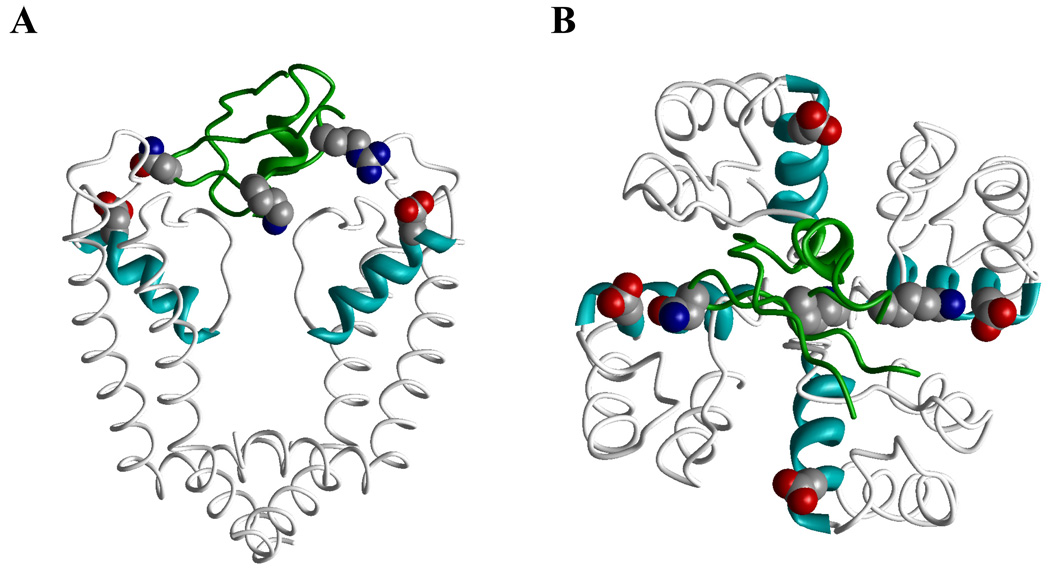
A, Complex of KcsA with charybdotoxin (PDB index 2A9H). B, NMR structure of hanatoxin1 (PDB 1D1H) on the same scale as the X-ray structure of Kv1.2 (PDB 2A79).
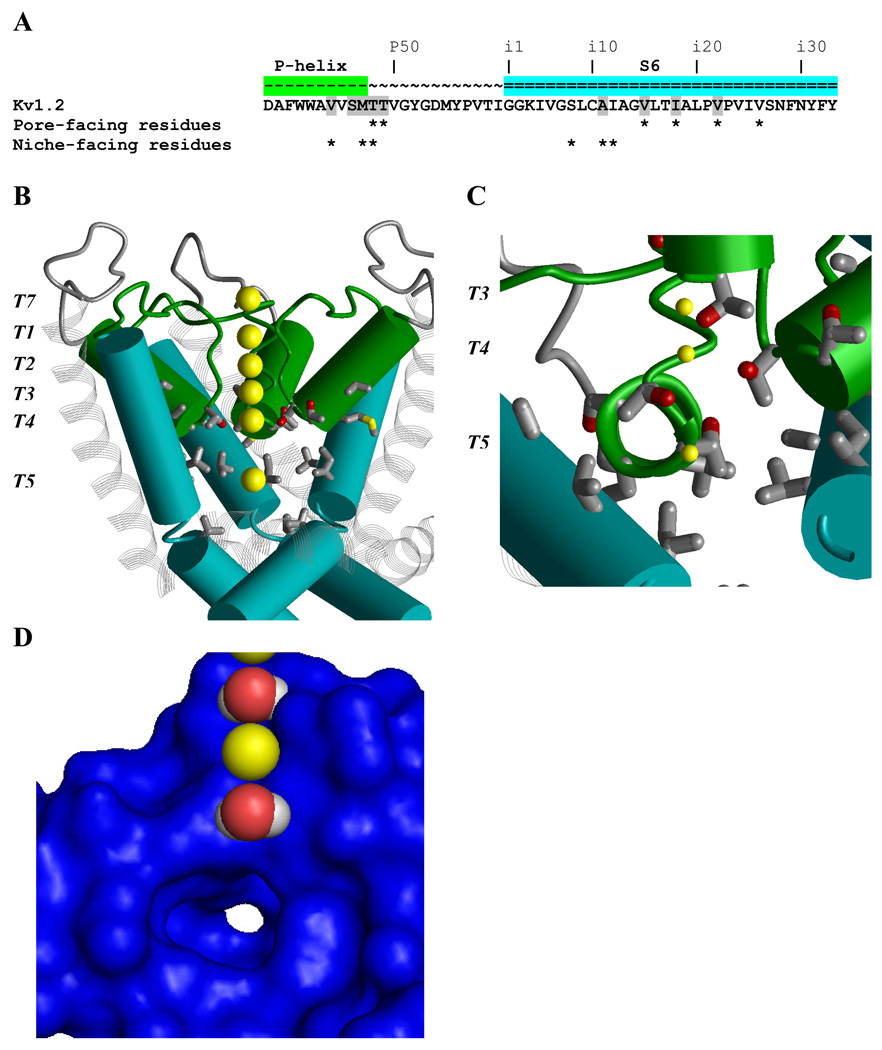
A, P-S6 sequence of Kv1.2 with residue labels. Positions where ligand-sensing residues have been identified in various Kv channels are highlighted. Residues whose Cα-Cβ bonds face the inner pore and/or the niches are marked by asterisks. B Side view of the Kv1.2 structure with P-helices (green), S6s (cyan) and S5s (gray strands). One subunit is removed for clarity. Yellow spheres show K+ ions in the center of the inner pore (K+T5), at the extracellular side of the channel (K+T7), and in the outer pore (K+T1, K+T2, K+T3, and K+T4). Sidechains of residues highlighted in A are shown. In the inner pore, the ligand-sensing positions are exemplified by Tp48 and Tp49 at the level of K+T4, Vi15 at the level of K+T5, and Ii18 and Vi22 at the helix kink. C, View from inside the pore along a P-helix shown by the ribbon. Side chains of Vp44, Sp46, Mp47, Tp48, and Tp49 in the helix represent ligand-sensing position in various Kv channels. K+T3, and K+T4, and K+T5 are shown by small yellow spheres. D, View at the fraction of the protein surface from inside the pore. K+T2 and K+T4 are replaced with water molecules. K+T5 is removed to show a niche with a white opening at the far end. In K+ channels, the niches contain ligand-sensing residues.
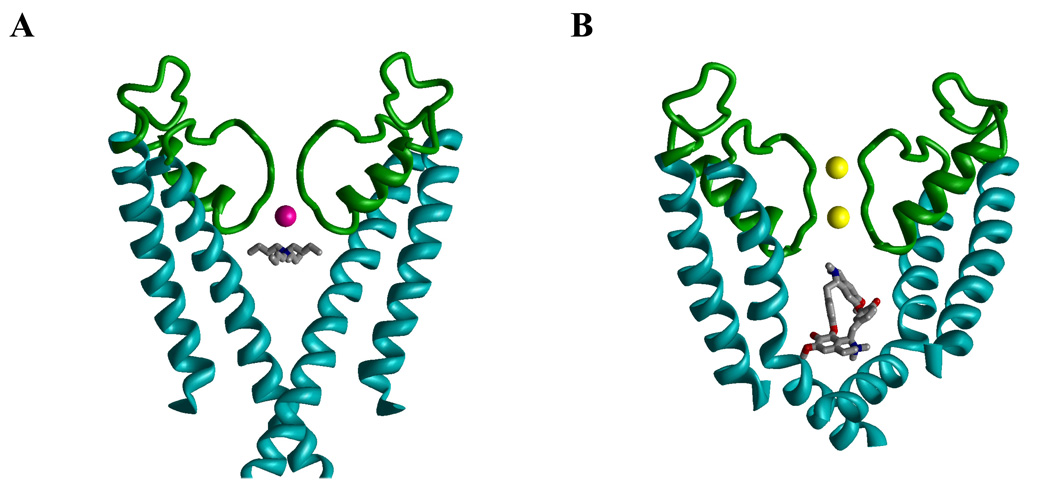
A, X-ray structure (PDB Index 2BOB) of tetrabutylammonium trapped in the closed conformation of KcsA. The thallium ion in position 4 of the selectivity filter is colored magenta. B, Kv1.2-based model of the open Kv1.3 with d-tubocurarine. K+ ions in positions 1 and 3 are yellow. In both complexes, the ammonium group of the ligand is at the focus of the macrodipoles of the P-loop helices (green).
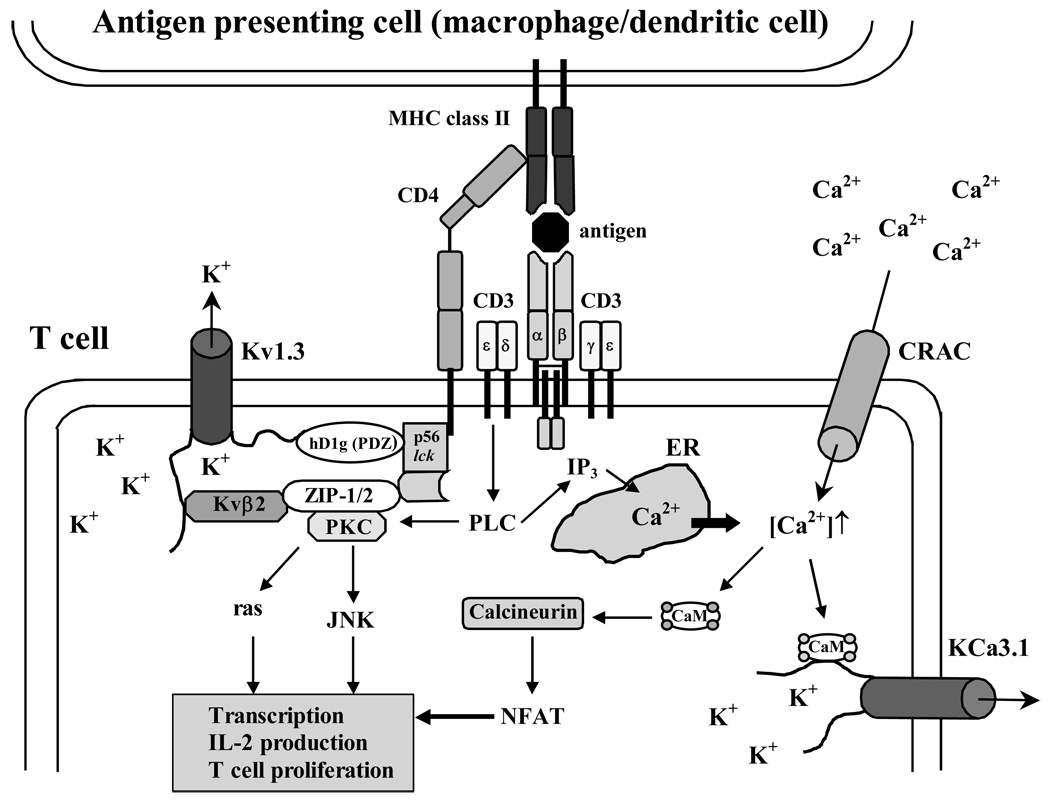
Engagement of the T-cell receptor/CD3 complex through at an antigenic peptide presented in the context of major histocompatibility complex (MHC) class II activates protein kinase C (PKC) and generates IP3, which liberates Ca2+ from intracellular stores. The rise in [Ca2+]i activates the phosphatase calcineurin, which then dephosphorylates the transcription factor nuclear factor of activated T cells (NFAT) enabling it to accumulate in the nucleus and bind to the promoter of the interleukin-2 (IL-2) gene. Parallel activation of the c-Jun N-terminal kinase (JNK) and ras by PKC results in the activation of other transcription factors and initiates transcription of various genes and finally T cell proliferation. CaM: calmodulin; hD1g: human homologue of the Drosophila disc-large tumor suppressor protein.
Schematic presentation of the Kv1.3-KTX complex reconstructed from the model of Lange et al. A, Side view with two channel subunits removed for clarity. B, Top view with cytoplasmic half of the channel removed for clarity.
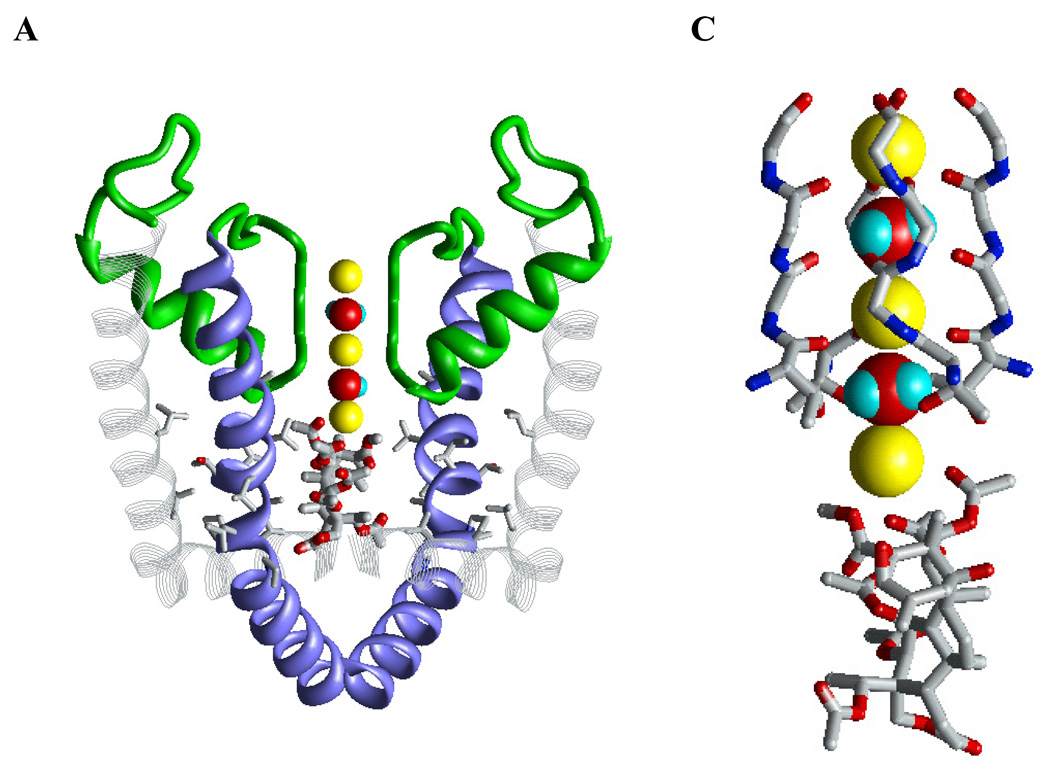
A, Side view of the model with only two of the four S5-P-S6 chains shown for clarity. The selectivity-filter area is loaded with two K+ ions (positions 1 and 3) and two water molecules (positions 2 and 4). The third K+ ion was initially placed in position 5. During energy optimization, it was chelated by three acetoxy groups of correolide, shifted upwards and occurred approximately in the same position as the ammonium groups of TBA and d-tubocurarine (Figure 4). Sticks show side chains of correolide-sensing residues in the inner helixes (blue) and outer helices (gray strands). B, Close-up view of the complex, in which the signature-sequence TVGYGp53 backbones and Thrp49 side chains are shown as sticks. Ions K+T1 and K+T3 are octa-coordinated by the backbone carbonyls. K+T4’, is coordinated by three acetoxy groups of correolide and a water molecule in site T4. In addition, four Thrp49 sidechain oxygens are within 4 Å from K+T4’, and P-helices’ macrodipoles can additionally stabilize this ion.
References
-
- Catterall W, Gutman GA. Pharmcol. Rev. 2005;57:385.
-
- Kubo Y, Adelman JP, Clapham DE, Jan LY, Karschin A, Kurachi Y, Lazdunski M, Nichols CG, Seino S, Vandenberg CA. Pharmacol. Rev. 2005;57:509. - PubMed
-
- Goldstein SA, Bayliss DA, Kim D, Lesage F, Plant LD, Rajan S. Pharmacol. Rev. 2005;57:527. - PubMed
-
- Wei AD, Gutman GA, Aldrich R, Chandy KG, Grissmer S, Wulff H. Pharmacol. Rev. 2005;57:463. - PubMed
-
- Gutman GA, Chandy KG, Grissmer S, Lazdunski M, McKinnon D, Pardo LA, Robertson GA, Rudy B, Sanguinetti MC, Stuhmer W, Wang X. Pharmacol. Rev. 2005;57:473. - PubMed
Publication types
MeSH terms
Substances
Grants and funding
LinkOut - more resources
Full Text Sources
Other Literature Sources
Medical
