. 2008 May 13:8:52.
doi: 10.1186/1471-213X-8-52.

The transcription factor Nfix is essential for normal brain development

Affiliations

The transcription factor Nfix is essential for normal brain development

Christine E Campbell et al. BMC Dev Biol. .

Abstract

Background: The Nuclear Factor I (NFI) multi-gene family encodes site-specific transcription factors essential for the development of a number of organ systems. We showed previously that Nfia-deficient mice exhibit agenesis of the corpus callosum and other forebrain defects; Nfib-deficient mice have defects in lung maturation and show callosal agenesis and forebrain defects resembling those seen in Nfia-deficient animals, while Nfic-deficient mice have defects in tooth root formation. Recently the Nfix gene has been disrupted and these studies indicated that there were largely uncharacterized defects in brain and skeletal development in Nfix-deficient mice.

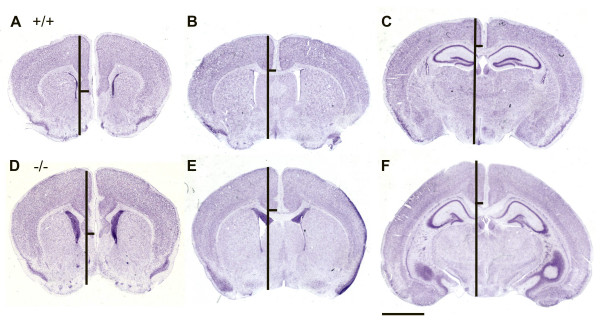
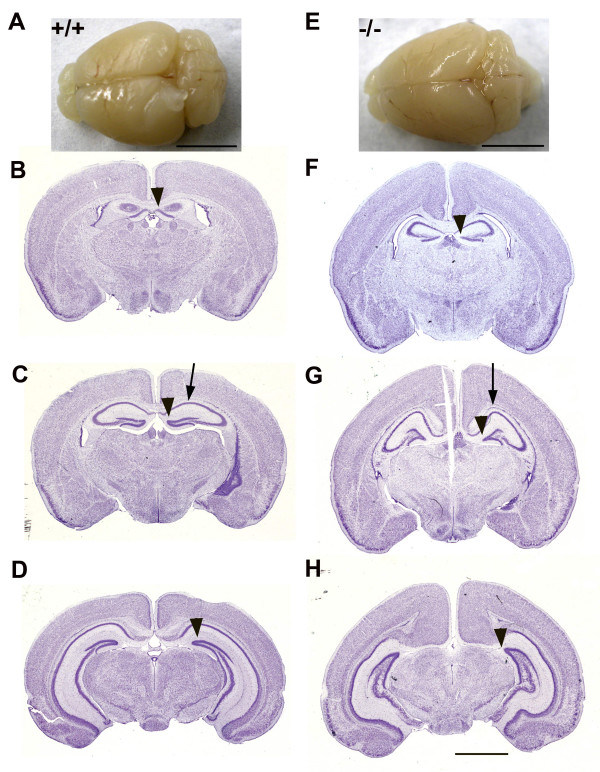
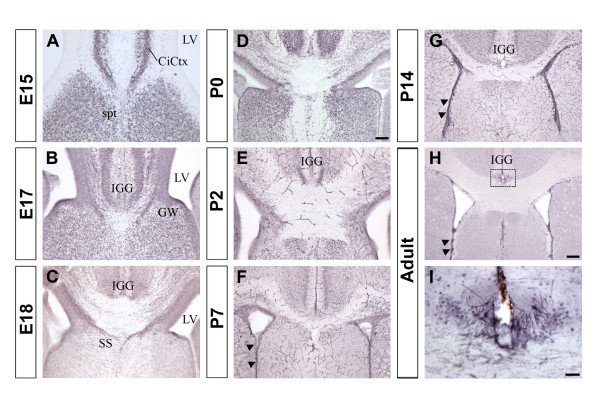
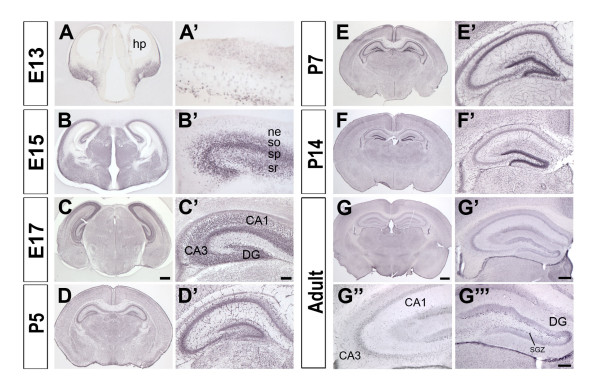
Results: Here we show that disruption of Nfix by Cre-recombinase mediated excision of the 2nd exon results in defects in brain development that differ from those seen in Nfia and Nfib KO mice. In particular, complete callosal agenesis is not seen in Nfix-/- mice but rather there appears to be an overabundance of aberrant Pax6- and doublecortin-positive cells in the lateral ventricles of Nfix-/- mice, increased brain weight, expansion of the cingulate cortex and entire brain along the dorsal ventral axis, and aberrant formation of the hippocampus. On standard lab chow Nfix-/- animals show a decreased growth rate from ~P8 to P14, lose weight from ~P14 to P22 and die at ~P22. If their food is supplemented with a soft dough chow from P10, Nfix-/- animals show a lag in weight gain from P8 to P20 but then increase their growth rate. A fraction of the animals survive to adulthood and are fertile. The weight loss correlates with delayed eye and ear canal opening and suggests a delay in the development of several epithelial structures in Nfix-/- animals.

Conclusion: These data show that Nfix is essential for normal brain development and may be required for neural stem cell homeostasis. The delays seen in eye and ear opening and the brain morphology defects appear independent of the nutritional deprivation, as rescue of perinatal lethality with soft dough does not eliminate these defects.


Figures

Figure 1
Figure 1
Disruption of the Nfix gene. A) Nfix targeting vector construction and predicted PCR products. Fragments including exon 2 of the wild type Nfix gene (Wild Type Allele) were used to construct the Targeting Vector. The Targeting Vector has one loxP site inserted ~400 nt 5' to exon 2 and a FRT-flanked PGK-Neo cassette (white arrow) with a second 3' loxP site ~600 nt 3' to the end of exon 2. Arrows show the location of PCR primers within genomic DNA used to detect the Wild Type Allele (WT PCR), the targeted Conditional Allele (CA PCR) and the Knockout allele (KO PCR); and primers from outside of and within the targeting vector used to verify correct genomic targeting at the 5' (5' PCR) and 3' (3' PCR) ends of the vector. Males with the Conditional Allele were bred with females expressing Cre recombinase in oocytes from the ZP3 promoter to generate the knockout allele (After Cre) lacking exon 2. B&C) Nested PCR showing targeted integration at the 5' (B) and 3' (C) ends of the conditional allele. B) A gel of products from nested PCR reactions with primers from genomic DNA 5' to the 5' end of the targeting vector, and primers within the 5'-most loxP site that yield no product from WT DNA and a 2831 bp product (arrow) from the conditional allele (CA 5' PCR). ES clones 10, 22, 24, 25 and 38 were strongly positive while clones 27, 28, 36, 46 and 48 were negative. Marker sizes in kb are on the left. Positive signals were verified in multiple PCR reactions. C) A gel of nested PCR products of primer pairs where one primer of each pair was located in genomic DNA outside of the 3'-most fragment of DNA present in the targeting vector and the other primer was present within the 3'-most loxP site of the targeting vector (3' PCR). Negative control DNA from non-electroporated ES cells shows no signal while clones 25, 38 and 40 yield a 5096 bp product (arrow, CA 3' PCR) specific for the correctly targeted Conditional Allele. The specificity of both the 5' and 3' PCR fragments was also confirmed by restriction enzyme digestion. Marker sizes in kb are on the left. D) PCR genotyping of Nfix +/+, c/+ and c/c mice. Mice heterozygous for the CA allele were bred, tail samples of progeny were collected, and the DNA was subjected to PCR using primers that flank the 5' most loxP site yielding products of 214 bp for the wild type (WT) allele and 415 bp for the Conditional (CA) Allele. Marker sizes in bp are on the left. E) RT-PCR showing the absence of exon 2-containing Nfix transcripts in Nfix-/- mice. RNA was prepared from the livers of Nfix+/+, -/+ and -/- animals, subjected to RT reactions and the resulting cDNA was subjected to PCR with primers in exons 1 and 3 of Nfix. RNAs containing exon 2 yield products of 606 bp while RNAs lacking exon 2 yield products of 75 bp. Note that some 75 bp product is formed from RNA in WT animals and we have confirmed by QPCR and sequencing that a small fraction of Nfix transcripts in WT animals are directly spliced from exon 1 to exon 3.
Figure 2
Figure 2
Growth defects in Nfix-/- animals. Delayed weight gain and development in Nfix-/- animals. A) Reduced weight gain in Nfix-/- animals on regular chow. The weights of progeny of Nfix-/+ parents were measured and plotted according to genotype. Note that Nfix-/- animals showed a slower weight gain from ~P6 and died at ~P22 when maintained on standard lab chow. Closed circles, WT (+/+); gray circles, Nfix-/+ (HET); open circles, Nfix-/- (KO). B) Increased weight gain of Nfix-/- animals fed a soft dough diet. The cages containing litters of Nfix-/+ parents were supplemented from P10 with soft transgenic dough. Weight gain and survival were increased substantially compared to non-supplemented litters (e.g. 2A). Symbols are as in panel A. C) Delay in eyelid opening in Nfix-/- mice. Eyelid opening was measured at various times after birth in progeny of Nfix-/+ animals. Nfix-/- animals showed an ~2 day delay in eyelid opening. Closed circles, WT (+/+); closed squares, HET (Nfix-/+); open circles, KO (Nfix-/-). The numbers following the genotype indicate the number of animals analyzed. D) Delay in ear canal opening in Nfix-/- mice. The opening of the ear canal was assessed at various times after birth in progeny of Nfix-/+ animals. Nfix-/- (KO) animals showed an ~4 day delay in ear canal opening. Symbols are as in panel C. The data in panels C and D are from an ~50% mixture of dough-supplemented and non-supplemented litters.
Figure 3
Figure 3
Aberrant cortex depth and ventricular zone cells in Nfix-/- mice. Brains from WT (+/+) and Nfix-/- animals were harvested, fixed in 4% PFA and imaged before (A) or after (B-E) sectioning, staining and mounting. A) Gross structure of P22 brains of WT (+/+) and Nfix-/- animals. Note difference in cortex anterior-posterior length (double-headed arrows). B) Cresyl violet-stained coronal sections of P22 WT (+/+) and Nfix-/- brains. Arrows denote normal ventricular region in Nfix+/+ and aberrant ventricular zone cells in Nfix-/- brains. C) Immunostaining of Pax6 in coronal sections of P16 WT (+/+) and Nfix-/- brains. Arrow shows Pax6 expression in aberrant ventricular zone cells of an Nfix-/- brain and in the ventricular zone of a +/+ littermate brain. D)Pax6 and phospho-histone H3 staining of the ventricular region. Pax6 (α-Pax6, panels 1&3) and phospho-histone H3 (α-pH3, panels 2&4) immuno-staining of ventricular regions of P16 WT (+/+, panels 1&2) and Nfix-/- (-/- panels 3&4) brains. Arrows in panels 2&4 denote some pH3-positive cells. Note that most of the Pax6 positive ventricular cells in the -/- brains do not react with α-pH3. Bar in panel 1 = 100 μm for D1-4 and 500 μm for both panels of C. E) Doublecortin (DCX) immuno-staining in p69 WT (+/+) and Nfix-/- brains. Panels 2&4 are higher magnification images of the boxed regions of panels 1&2, respectively. Arrows show the locations of some DCX-positive cells. Bars in panels 2&4 = 50 μm and in panel 3 = 2 mm.
Figure 4
Figure 4
Expanded DV size of the brain in Nfix-/- mice. Images of Bregma-matched sections of P22 brains of WT (+/+) (A-C) and Nfix-/- (D-F) brains. Brains were fixed in 4% PFA, embedded, sectioned, stained with cresyl violet, and mounted. Three sections of each brain at different Bregma levels were assessed for the DV midline depth of the cortex and the midline DV depth of the entire brain. The vertical bars show the entire DV depth while the horizontal bar denotes the measured depth of the cortex from the dorsal surface. Note the increase in both midline DV cortex and subcortical region depth. Measurements from 3 sections each from 3 pairs of littermate brains of the indicated ages are shown in Table 1. Scale bar = 2 mm.
Figure 5
Figure 5
Aberrant hippocampus and cingulate cortex in Nfix-/- mice. Comparison of the shape of the hippocampus and cingulate cortex in P28 WT +/+ (A-D) and Nfix-/- (E-H) brains. A) Image of a dorsal view of the brain of a +/+ mouse. Scale bar = 5 mm. B) Coronal section of the +/+ brain at the anterior pole of the hippocampus at about Bregma -0.94. The arrowhead indicates the dentate gyrus. C) Coronal section of the +/+ brain at about Bregma -1.70. The arrowhead indicates the dentate gyrus and the arrow the dorsal most point of the hippocampus. D) Coronal section of the +/+ brain at about Bregma -2.92. The arrowhead indicates the dentate gyrus. E) Image of a dorsal view of the brain of an Nfix-/- mouse. Scale bar = 5 mm. Note the difference in A-P extent and the difference in shape of the cerebellum compared to A. F) Coronal section of the -/- brain at about Bregma -0.94. The arrowhead indicates the dentate gyrus. G) Coronal section of the -/- brain at about Bregma -1.70. The arrow indicates the dorsal enlargement of the hippocampus and the arrowhead the shortened dentate gyrus. H) Coronal section of the -/- brain at about -2.92. The arrowhead indicates the medial end of the external capsule. Scale bar = 2 mm for B-D and F-H.
Figure 6
Figure 6
Specificity of the α-NFIX antisera used for immunohistochemistry. The specificity of the α-NFIX antibodies was assessed by both Western Blot (A) and immunohistochemistry (B-E'). A) Western blots of extracts containing the indicated NFI proteins. The samples in each lane were as indicated and the left panel shows a membrane probed with α-HA antibodies and the right panel a membrane probed with α-NFIX antibodies. The asterisks to the left and right of the panels denote non-specific bands seen in all lanes, the numbers to the left indicate the size in kDa of marker proteins, the A, B, C and X between the panels shows the migration positions of NFIA, NFIB, NFIC and NFIX respectively as assessed by α-HA staining while the X on the right shows the position of the major NFIX band assessed by α-NFIX staining. The bands below X are most likely proteolysis products lacking the N-terminus since they are not detected by α-HA antibodies. Note no cross reactivity of the α-NFIX antibodies with the other 3 NFI gene products. B&B') Coronal section (B) and higher magnification (B') of a WT E17 brain stained with α-NFIX antibodies. Note clear staining of cortex and subcortical regions. C&C') Coronal section (C) and higher magnification (C') of a WT E17 brain stained with α-NFIX antibodies that had been preincubated with an excess of the peptide to which the antibodies had been generated. D&D') Coronal section (D) and higher magnification (D') of a WT P14 brain stained with α-NFIX antibodies. Note clear cellular staining in the dentate gyrus. E&E') Coronal section (E) and higher magnification (E') of an Nfix-/- P12 brain stained with α-NFIX antibodies. Note the absence of cellular staining and only very weak diffuse background staining. F-I) Immunofluorescence showing Nfix expression in nuclei of cells in wildtype E17 brains. F) Low magnification image of coronal section showing Nfix expression (red). The section extends from just left of the midline to just past the lateral ventricle on the right and encompasses the right lateral ventricle. Dashed box denotes region expanded in G-I. G) High magnification image of immuno-fluorescence of Nfix expression. H) High magnification image of Dapi staining of nuclei, I) Merged images of G and H showing that Nfix expression is predominantly nuclear. Bar in B = 400 μm for B&C, bar in B' = 80 μm for B'&C', bar in D = 600 μm for D&E and bar in D' = 250 μm for D'&E', bar in F = 200 μm and bar in G = 50 μm in G-I.
Figure 7
Figure 7
NFIX expression in the developing telencephalon. NFIX expression during telencephalon development from E12 to adult. In each panel (A-H) the square box indicates a corresponding higher magnification image in A'-H'. A' and B' show NFIX expression in the roof plate and the preplate, respectively. Panels C'-H' show the expression of NFIX during cortical layer development. Scale bar in H is 600 μm for panels A and B; 520 μm for panel C; 480 μm for D; 400 μm for E; 625 μm for panels F-H. Scale bar in H' is 150 μm for panel A'; 80 μm for B'; 50 μm for C' and D'; 200 μm for E'; 100 μm for F'; 250 μm for G' and H'. GE, ganglionic eminence; Pir, piriform cortex; spt; septum; iz, intermediate zone; mz, marginal zone; pp, preplate; rp, roof plate; sp, subplate; svz, subventricular zone; vz, ventricular zone; I, II/III, IV, V, VI, cortical layers.
Figure 8
Figure 8
NFIX expression at the cortical midline. Expression of NFIX protein at the midline from E15 to adult. Panel A shows that NFIX is strongly expressed in the cingulate cortex and the septum at E15. NFIX is detected in the regions containing the indusium griseum (IGG) and the glia wedge (GW) at E17 (panel B) and in the region containing the subcallosal sling (SS) at E18 (panel C). NFIX was also present at the cortical midline from P0 to adult (D-I) and in the ventricular zone from P7 to adult (arrowheads in F-H). Panel I (higher power of view of the box in H) shows NFIX positive cells in the region of the indusium griseum. Scale bar in D is 70 μm for A; 100 μm for B, C and D. Scale bar in H is 200 μm for panels G and H. Scale bar in I is 30 μm. CiCtx, cingulate cortex; spt; septum; LV, lateral ventricle; IGG, indusium griseum glia; GW, glia wedge; SS, subcallosal sling.
Figure 9
Figure 9
NFIX expression in the hippocampus. NFIX protein expression during hippocampal development from E13 to adult. Each panel (A-G) was magnified for a better view of the hippocampus (A'-G'). NFIX was first expressed in the hippocampal primordium at E13 (A and A'). At E15, NFIX expression was found in the stratum oriens, stratum pyramidale and stratum radiatum layers of the hippocampus (B'). NFIX was strongly expressed in all the areas of the hippocampus at E17 (C') and at P5 (D'). At P7 and P14 strong expression of NFIX is detected in the dentate gyrus (E' and F', respectively). In the adult (G and G') NFIX is expressed at lower levels, although stronger expression is observed in the CA3 region compared to CA1 (G") and some scattered cells were detected in the dentate gyrus and the subgranular zone (G"'). Scale bar in C is 270 μm for panel A; 360 μm for B; 400 μm for C; scale bar in C' is 60 μm for A', B'; 90 μm for C'; Scale bar in G is 600 μm for D; 625 μm for E, 700 μm for F and G. Scale bar in G' is 200 μm for D'; 260 μm for E', 290 μm for F' and G'. Scale bar in G"' is 100 μm for G"' and G". hp, hippocampal primordium; ne, neuroepithelium; so, stratum oriens; sp, stratum pyramidale; sr, stratum radiatum; DG, dentate gyrus; CA, Ammon's horn; SGZ, subgranular zone.

References

    1. Nagata K, Guggenheimer R, Enomoto T, Lichy J, Hurwitz J. Adenovirus DNA replication in vitro Identification of a host factor that stimulates synthesis of the preterminal protein-dCMP complex. Proc Natl Acad Sci U S A. 1982;79:6438–6442. doi: 10.1073/pnas.79.21.6438. - DOI - PMC - PubMed
    1. Nagata K, Guggenheimer RA, Hurwitz J. Specific binding of a cellular DNA replication protein to the origin of replication of adenovirus DNA. Proc Natl Acad Sci U S A. 1983;80:6177–6181. doi: 10.1073/pnas.80.20.6177. - DOI - PMC - PubMed
    1. de Jong RN, Vliet PC van der. Mechanism of DNA replication in eukaryotic cells: cellular host factors stimulating adenovirus DNA replication. Gene. 1999;236:1–12. doi: 10.1016/S0378-1119(99)00249-8. - DOI - PubMed
    1. Gronostajski RM. Roles of the NFI/CTF gene family in transcription and development. Gene. 2000;249:31–45. doi: 10.1016/S0378-1119(00)00140-2. - DOI - PubMed
    1. Kruse U, Qian F, Sippel AE. Identification of a fourth Nuclear Factor I gene in chicken by cDNA cloning: NFIX. Nucl Acids Res. 1991;19:6641. doi: 10.1093/nar/19.23.6641. - DOI - PMC - PubMed

Publication types

MeSH terms

Substances