. 2008 May 13:9:36.
doi: 10.1186/1471-2156-9-36.

PGA: power calculator for case-control genetic association analyses

Affiliations

PGA: power calculator for case-control genetic association analyses

Idan Menashe et al. BMC Genet. .

Abstract

Background: Statistical power calculations inform the design and interpretation of genetic association studies, but few programs are tailored to case-control studies of single nucleotide polymorphisms (SNPs) in unrelated subjects.

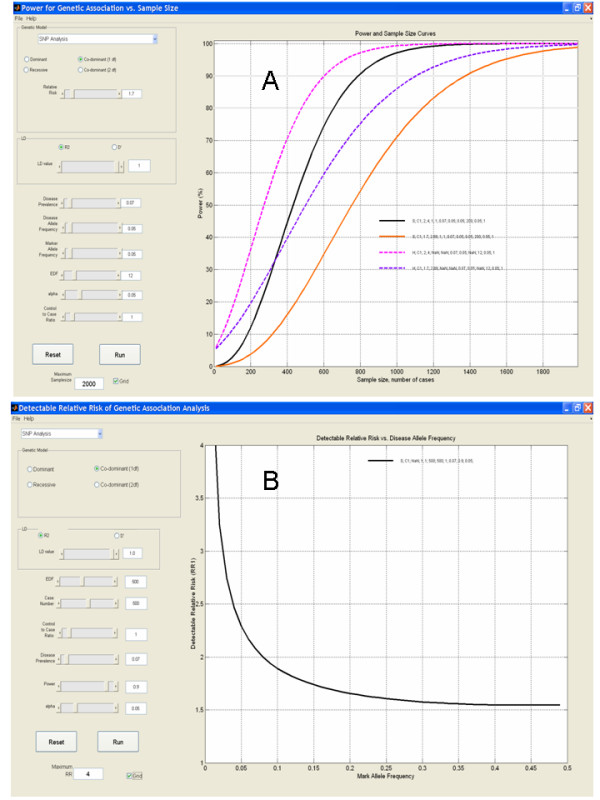
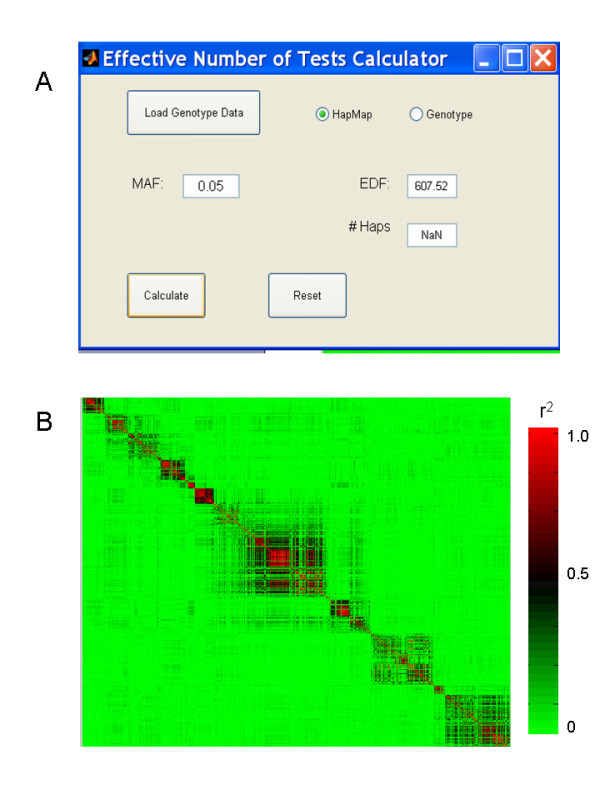
Results: We have developed the "Power for Genetic Association analyses" (PGA) package which comprises algorithms and graphical user interfaces for sample size and minimum detectable risk calculations using SNP or haplotype effects under different genetic models and study constrains. The software accounts for linkage disequilibrium and statistical multiple comparisons. The results are presented in graphs or tables and can be printed or exported in standard file formats.

Conclusion: PGA is user friendly software that can facilitate decision making for association studies of candidate genes, fine-mapping studies, and whole-genome scans. Stand-alone executable files and a Matlab toolbox are available for download at: http://dceg.cancer.gov/bb/tools/pga.


Figures

Figure 1
Figure 1
Graphical user interfaces for statistical power calculations. (A) PGA1 – statistical power is calculated and plotted for different sample sizes and various genetic and statistical parameters. Input variables (e.g. 'Genetic mode of inheritance', 'disease allele frequency', 'relative risk (RR)', etc.) can be specified using slider controls, or by typing specific values in the corresponding text boxes. Pressing the 'Run' button executes the calculations and plots the relationships between power and sample size according to the specified study parameters. A keyed legend listing the corresponding parameters is shown on the graph. Up to eight different analyses (color-coded) can be displayed simultaneously, allowing the comparison of different scenarios. (B) PGA2 – Minimal detectable relative risk (MDRR) is calculated and plotted for various minor allele frequencies (MAFs) of potential genotyped loci. Input and output is similar to PGA1.
Figure 2
Figure 2
Effective degrees of freedom calculator. (A) HapMap SNP genotype data from human chromosome 8q24 (chr8:128100000-128700000) is used as an input. The calculated EDF for SNPs with MAF > 0.05 in this dataset is 608. (B) LD map for the selected SNPs is also displayed in the output.

References

    1. Cardon LR, Bell JI. Association study designs for complex diseases. Nature reviews. 2001;2:91–99. doi: 10.1038/35052543. - DOI - PubMed
    1. Lander ES, Schork NJ. Genetic dissection of complex traits. Science. 1994;265:2037–2048. doi: 10.1126/science.8091226. - DOI - PubMed
    1. Risch N, Merikangas K. The future of genetic studies of complex human diseases. Science. 1996;273:1516–1517. doi: 10.1126/science.273.5281.1516. - DOI - PubMed
    1. Gordon D, Finch SJ. Factors affecting statistical power in the detection of genetic association. The Journal of clinical investigation. 2005;115:1408–1418. doi: 10.1172/JCI24756. - DOI - PMC - PubMed
    1. Lubin JH, Gail MH. On power and sample size for studying features of the relative odds of disease. American journal of epidemiology. 1990;131:552–566. - PubMed

Publication types

MeSH terms