. 2008 May;14(5):661-73.
doi: 10.1016/j.devcel.2008.02.004.

Glucose restriction inhibits skeletal myoblast differentiation by activating SIRT1 through AMPK-mediated regulation of Nampt

Affiliations

Glucose restriction inhibits skeletal myoblast differentiation by activating SIRT1 through AMPK-mediated regulation of Nampt

Marcella Fulco et al. Dev Cell. 2008 May.

Abstract

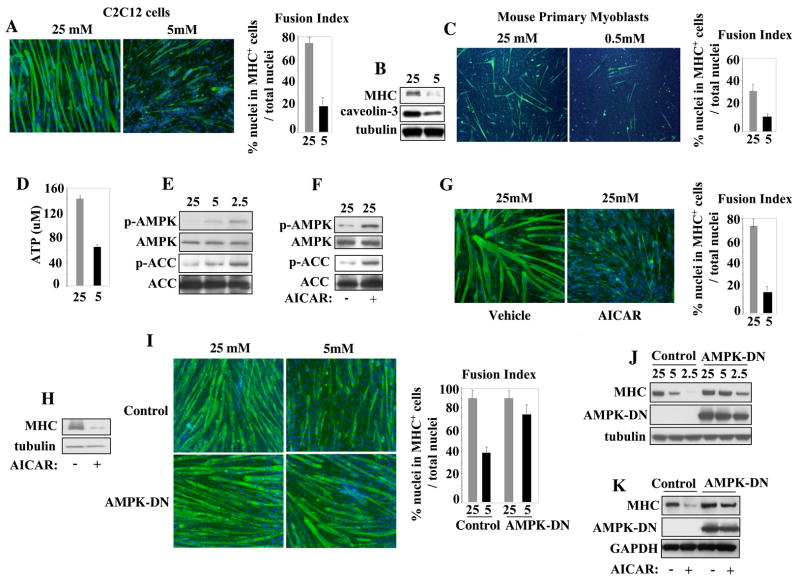
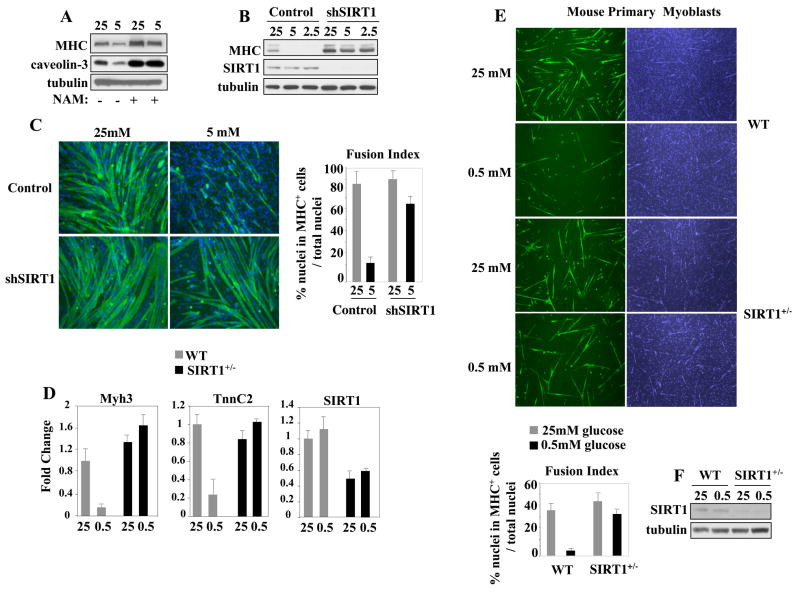
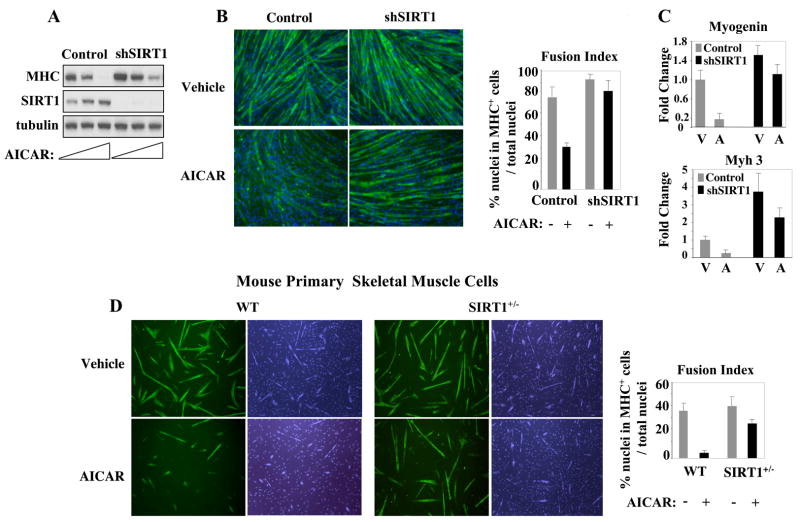
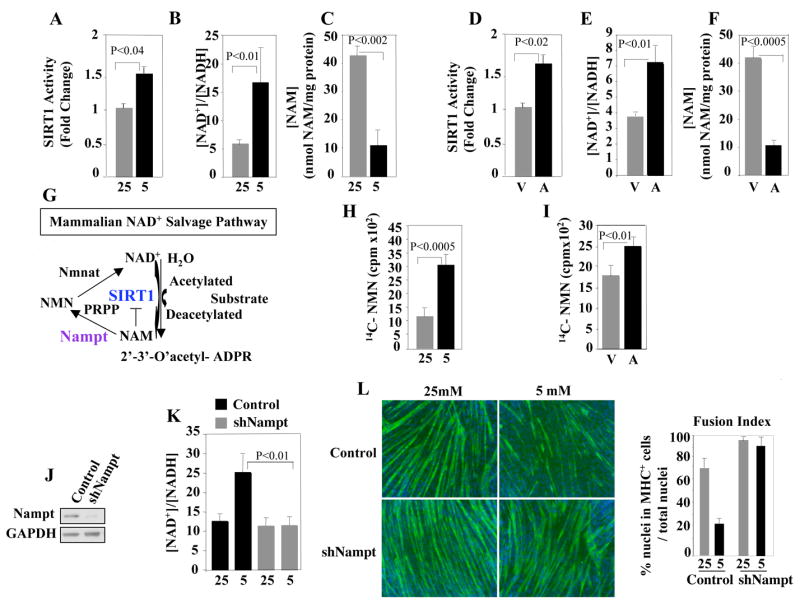
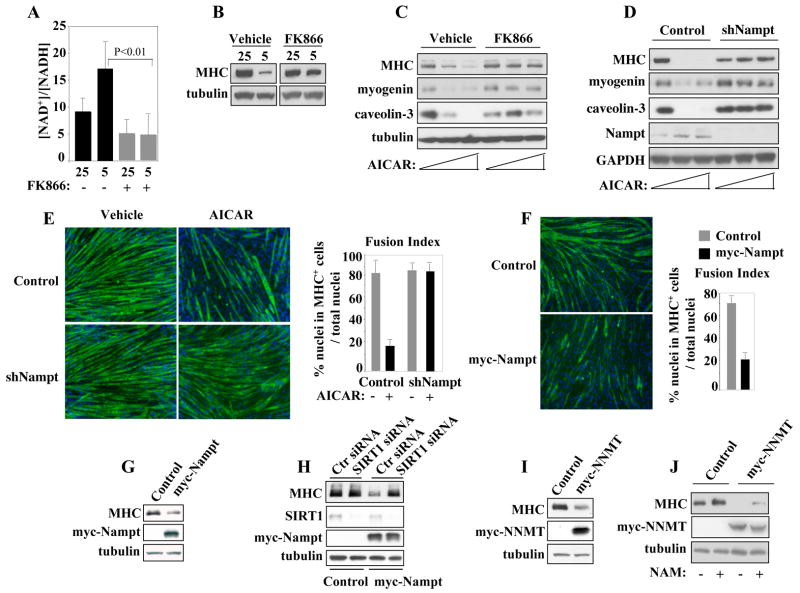
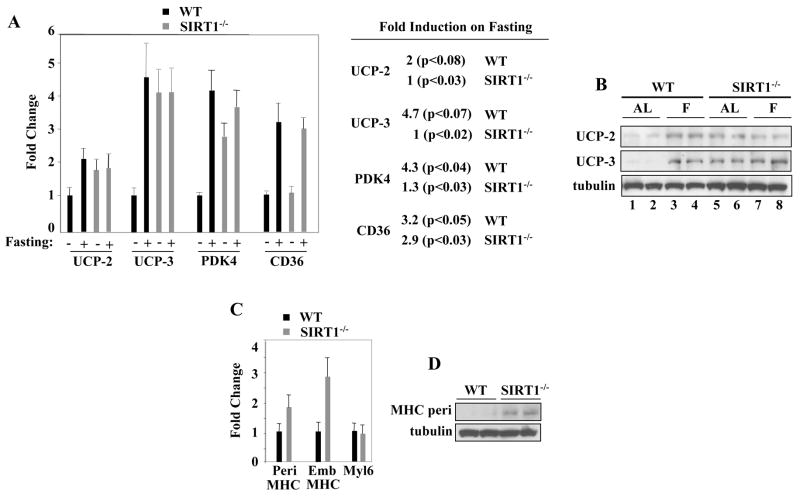
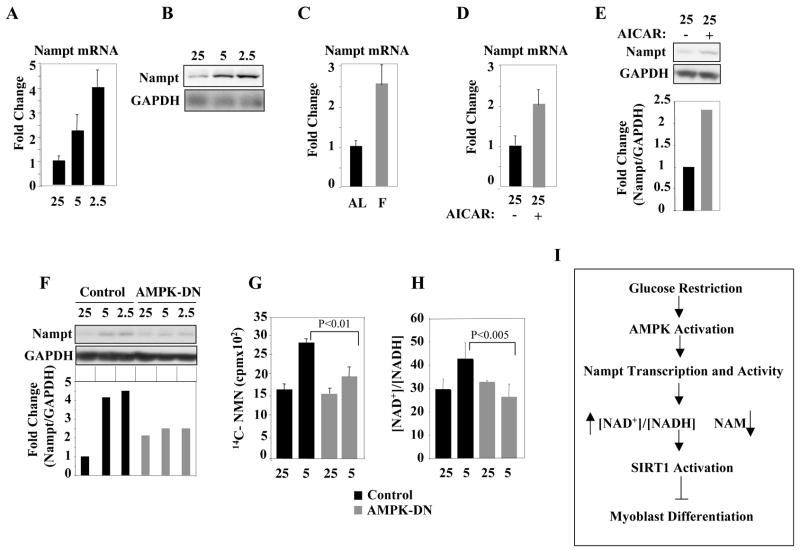
It is intuitive to speculate that nutrient availability may influence differentiation of mammalian cells. Nonetheless, a comprehensive complement of the molecular determinants involved in this process has not been elucidated yet. Here, we have investigated how nutrients (glucose) affect skeletal myogenesis. Glucose restriction (GR) impaired differentiation of skeletal myoblasts and was associated with activation of the AMP-activated protein kinase (AMPK). Activated AMPK was required to promote GR-induced transcription of the NAD+ biosynthetic enzyme Nampt. Indeed, GR augmented the Nampt activity, which consequently modified the intracellular [NAD+]:[NADH] ratio and nicotinamide levels, and mediated inhibition of skeletal myogenesis. Skeletal myoblasts derived from SIRT1+/- heterozygous mice were resistant to the effects of either GR or AMPK activation. These experiments reveal that AMPK, Nampt, and SIRT1 are the molecular components of a functional signaling pathway that allows skeletal muscle cells to sense and react to nutrient availability.


Figures

Figure 1
Figure 1
Glucose Restriction Inhibits Differentiation of Skeletal Myoblasts and Activates AMPK. (A) C2C12 cells were differentiated in a medium (differentiation medium, DM) supplemented with either 25mM or 5mM glucose for 48 hours. Immunofluorescence (IF) was performed with a MHC antibody. DAPI marks the cell nuclei. The fusion index reported throughout this study was determined as described in Experimental Procedure (p<0.05). (B) Immunoblot for MHC, caveolin-3, and tubulin proteins from cell extracts derived from C2C12 cells cultured as in (A). (C) Mouse primary myoblasts were cultured in DM with either 25mM or 0.5mM glucose for 48 hours. IF was performed as in (A). (D) The ATP levels were determined in extracts of C2C12 cells cultured in DM with either 25mM or 5mM glucose. (E) Phosphorylation of AMPK (pT172) and of the AMPK substrate ACC (pS79) in C2C12 cells cultured in DM with 25mM, 5mM, or 2.5mM glucose determined by immunoblot with phospho-specific AMPK and ACC antibodies. The total levels of AMPK and ACC were determined with AMPK and ACC antibodies. (F) C2C12 cells were exposed to AICAR (0.5mM) and AMPK and ACC phosphorylation evaluated as in (E). (G) C2C12 cells were cultured in DM with 25mM glucose and exposed to either vehicle (DMSO) or AICAR (0.5mM) for 36 hours. IF was performed with an MHC antibody. (H) MHC and tubulin immunoblot of extracts of the cells described in (G). (I) C2C12 cells transduced with a retrovirus expressing a dominant negative form of AMPK (myc-tagged AMPK-DN) were cultured in DM supplemented with either 25mM or 5mM glucose. IF was performed with a MHC antibody. (J) Immunoblot of extracts derived from the cells described in (I) with the MHC, myc, and tubulin antibodies. (K) MHC, myc, and GAPDH immunoblot of extracts derived from the cells expressing myc-AMPK-DN exposed to AICAR (0.5mM).
Figure 2
Figure 2. SIRT1 Mediates the Effects of Glucose Restriction on Skeletal Myoblasts
(A) Extracts of C2C12 cells cultured in DM with either 25mM or 5mM glucose and without or with NAM (5mM) were immunoblotted with the MHC, caveolin-3, and tubulin antibodies. (B) C2C12 cells were transduced with a retrovirus expressing a RNA hairpin directed against SIRT1 (shSIRT1) and cultured in DM with 25mM, 5mM, or 2.5mM glucose. Immunoblot was performed with antibodies against MHC, SIRT1, and tubulin. (C) MHC IF of cells expressing control or hSIRT1 cultured in DM with 25mM or 5mM glucose. (D) RT-qPCR of transcripts (embryonic myosin heavy chain Myh3, troponin C2, and SIRT1) derived from freshly isolated mouse primary skeletal myoblasts of 4 weeks-old wild-type (WT) or SIRT1+/− heterozygous mice cultured in DM with 25mM or 0.5mM glucose. Three independently obtained RNA samples were evaluated. The values of each transcript were corrected for those of GAPDH transcripts. Error bars represent standard deviations (p< 0.05). (E) MHC IF of WT and SIRT1+/− skeletal myoblasts cultured in DM with 25mM or 0.5mM glucose. (F) SIRT1 and tubulin immunoblot of extracts from mouse primary myoblasts obtained from either WT or SIRT1+/− heterozygous animals cultured in either 25mM or 0.5mM glucose.
Figure 3
Figure 3. AMPK Activation Recapitulates the Effects of Glucose Restriction and is SIRT1-Dependent
(A) MHC, SIRT1, and tubulin immunoblot of extracts of C2C12 cells expressing shSIRT1 cultured in 25mM glucose and exposed to increasing (0.25–0.5mM) concentrations of AICAR for 36 hours. (B, C) MHC IF (B) and myogenin and Myh3 transcripts (C) of cells described in (A). V, DMSO; A, AICAR. (D) MHC IF of mouse primary skeletal myoblasts from WT or SIRT1+/− heterozygous mice cultured in DM with DMSO (vehicle) or AICAR (0.5mM) for 36–48 hours.
Figure 4
Figure 4. Effects of Glucose Restriction, AMPK Activation, or Nampt on [NAD+]/[NADH] Ratio, SIRT1 Activity, and Nicotinamide (NAM) Levels of Skeletal Muscle Cells
(A) SIRT1 activity was evaluated in extracts derived from C2C12 cells cultured in DM with 25mM or 5mM glucose, respectively, for 24 hr. (B) [NAD+]/[NADH] ratio and (C) NAM levels were determined in extracts of C2C12 cells cultured in DM with 25mM or 5mM glucose. (D) SIRT1 activity was evaluated in extracts derived from C2C12 cells exposed to vehicle or AICAR (0.5mM) for 24 hours. (E) [NAD+]/[NADH] ratio and (F) NAM levels were evaluated in C2C12 cells cultured in DM with 25mM glucose in the absence (vehicle, V) or presence of AICAR (A). (G) Schematic representation of the SIRT1-mediated deacetylation reaction and NAD+ salvage pathway. (H) Nampt enzymatic activity in extracts of C2C12 cells cultured in DM with 25mM or 5mM glucose. (I) Nampt enzymatic activity in extracts of C2C12 cells cultured in DM with 25mM glucose in the absence (V) or presence of AICAR (A). (J) Nampt and GAPDH immunoblot of C2C12 cells expressing a RNA hairpin against Nampt (shNampt). (K) [NAD+]/[NADH] ratio in cells expressing shNampt cultured in DM with 25mM or 5mM glucose. (L) MHC IF of control or shNampt-expressing C2C12 cells cultured in DM with 25mM or 5mM glucose. All the enzymatic measurements reported in this figure were repeated with three independent samples. Error bars represent standard deviations.
Figure 5
Figure 5. The Outcomes of AMPK Activation on Cell Differentiation Depend on Nampt and SIRT1
(A) [NAD+]/[NADH] ratio in C2C12 cells exposed to the Nampt-inhibitor FK866 (10nM) cultured in DM with either 25mM or 5mM glucose. (B) MHC and tubulin immunoblot of extracts from C2C12 cells exposed to FK866 (10nM). (C) MHC, myogenin, caveolin-3, and tubulin immunoblot of extracts of C2C12 cells exposed to increasing concentrations (0.25–0.5mM) of AICAR and FK866 (10nM) in DM with 25mM glucose. (D) MHC, myogenin, caveolin-3, Nampt and GAPDH immunoblot of extracts from C2C12 cells (control or shNampt) exposed to AICAR in DM with 25mM glucose. (E) MHC IF of control or shNampt-expressing C2C12 cells cultured in DM with 25mM glucose and 0.5mM AICAR or vehicle. (F) MHC IF of controls or myc-Nampt-expressing C2C12 cells cultured in DM with 25mM glucose. (G) MHC, myc, and tubulin immunoblot of extracts from the C2C12 cells described in (F). (H) MHC, SIRT1, myc, and tubulin immunoblot of extracts from C2C12 cells expressing myc-Nampt and transfected with either control (scrambled) or SIRT1 siRNA. Cells were cultured in DM with 25mM glucose. (I) MHC, myc, and tubulin immunoblot of extracts from C2C12 cells expressing myc-NNMT and cultured in DM with 25mM glucose. (J) Immunoblot were as described in (I) with extracts from control or NNMT-expressing C2C12 cells cultured in the absence or presence of NAM (5mM).
Figure 6
Figure 6. In Vivo Role of SIRT1 during Fasting
(A) RT-qPCR of UCP-2, UCP-3, PDK4, and CD36 transcripts from hindlimb muscles of WT and SIRT1−/− mice fed ad libitum (AL) or fasted for 48 hours. The values of each transcript were corrected for those of GAPDH transcripts. Error bars represent standard deviations. The RNAs obtained from three (n=3) animals per experimental group were analyzed. Fold induction and p-values are indicated in the right panel. (B) UCP-2, UCP-3, and tubulin immunoblot of extracts derived from hindlimb muscles of WT mice fed AL (lanes1–2) or fasted (F) for 48 hours (lanes 3–4) and SIRT1−/− mice fed AL (lanes 5–6) or fasted (F) for 48 hours (lanes 7–8). Muscles derived from two WT and two SIRT1−/− animals for each experimental condition were analyzed. (C) RT-qPCR of embryonic Myh3 and perinatal Myh8, and non-muscle Myl6 myosin transcripts in WT and SIRT1−/− mice. The values of each transcript were corrected for those of GAPDH transcripts. Error bars represent standard deviations. The RNAs obtained from three (n=3) animals per experimental group were analyzed. (D) MHC perinatal and tubulin immunoblot of extracts derived from hindlimb muscles of WT and SIRT1−/− mice. Two WT and two SIRT1−/− animals were analyzed
Figure 7
Figure 7. AMPK Mediates the Glucose Restriction-Induced Nampt Transcription
(A) RT-qPCR of Nampt RNA transcripts from C2C12 cells cultured in DM with 25mM, 5mM, or 2.5mM glucose. In all the experiments reported in this figure, the Nampt values were corrected for those of GAPDH transcripts. Error bars represent standard deviations. (B) Nampt and GAPDH immunoblot of extracts from C2C12 cells cultured as described in (A). (C) RT-qPCR of Nampt RNA transcripts from hindlimb muscles of mice (n=3) subjected to a 48 hr fast (F) or fed AL. (D) Nampt transcripts from C2C12 cells exposed to AICAR in DM with 25mM glucose. (E) Nampt immunoblot of extracts from C2C12 cells exposed to AICAR in DM with 25mM glucose. Quantification was performed by scanning the bands corresponding to the Nampt signal and correcting the values for those obtained from the GAPDH signal (Nampt/GAPDH ratio). (F) Nampt and GAPDH immunoblot of extracts from C2C12 cells expressing AMPK-DN in DM with 25mM, 5mM, or 2.5mM glucose. (G) Nampt activity in extracts from control or AMPK-DN-expressing C2C12 cells cultured in DM with 25mM or 5mM glucose (H) [NAD+]/[NADH] ratio in control or AMPK-DN-expressing C2C12 cells cultured in DM with 25mM or 5mM glucose. (I) Schematic illustration of the CR-AMPK-Nampt-SIRT1 pathway.

Comment in

References

    1. Aksoy S, Szumlanski CL, Weinshilboum RM. Human liver nicotinamide N-methyltransferase. cDNA cloning, expression, and biochemical characterization. J Biol Chem. 1994;269:14835–14840. - PubMed
    1. Amat R, Solanes G, Giralt M, Villarroya F. SIRT1 is involved in glucocorticoid-mediated control of uncoupling protein-3 gene transcription. J Biol Chem. 2007;282:34066–34076. - PubMed
    1. Anderson RM, Bitterman KJ, Wood JG, Medvedik O, Sinclair DA. Nicotinamide and PNC1 govern lifespan extension by calorie restriction in Saccharomyces cerevisiae. Nature. 2003;423:181–185. - PMC - PubMed
    1. Apfeld J, O’Connor G, McDonagh T, DiStefano PS, Curtis R. The AMP-activated protein kinase AAK-2 links energy levels and insulin-like signals to lifespan in C. elegans. Genes Dev. 2004;18:3004–3009. - PMC - PubMed
    1. Araki T, Sasaki Y, Milbrandt J. Increased nuclear NAD biosynthesis and SIRT1 activation prevent axonal degeneration. Science. 2004;305:1010–1013. - PubMed

Publication types

MeSH terms