. 2008 May 20;105(20):7309-14.
doi: 10.1073/pnas.0706032105. Epub 2008 May 13.

Cerebellar-dependent motor learning is based on pruning a Purkinje cell population response

Affiliations

Cerebellar-dependent motor learning is based on pruning a Purkinje cell population response

Nicolas Catz et al. Proc Natl Acad Sci U S A. .

Erratum in

  • Proc Natl Acad Sci U S A. 2008 Jul 22;105(29):10269

Abstract

The improvement of motor behavior, based on experience, is a form of learning that is critically dependent on the cerebellum. A well studied example of cerebellar motor learning is short-term saccadic adaptation (STSA). In STSA, information on saccadic errors is used to improve future saccades. The information optimizing saccade metrics is conveyed by Purkinje cells simple spikes (PC-SS) because they are the critical input to the premotor circuits for saccades. We recorded PC-SS of monkeys undergoing STSA to reveal the code used for improving behavior. We found that the discharge of individual PC-SS was unable to account for the behavioral changes. The PC-SS population burst (PB), however, exhibited changes that closely paralleled the qualitatively different changes of saccade kinematics associated with gain-increase and gain-decrease STSA, respectively. Gain-increase STSA, characterized by an increase in saccade duration, replicates the relationship between saccade duration and the end of the PB valid for unadapted saccades. In contrast, gain-decrease STSA, which sports normal saccade duration but reduced saccadic velocity, is characterized by a PB that ends well before the adapted saccade. This suggests that the duration of normal as well as gain-increased saccades is determined by appropriately setting the end of PB end. However, the duration of gain-decreased saccades is apparently not modified by the cerebellum because the PB signals ends too early to determine saccade end. In summary, STSA, and most probably cerebellar-dependent learning in general, is based on optimizing the shape of a PC-SS population response.


Conflict of interest statement

The authors declare no conflict of interest.

Figures

Fig. 1.
Fig. 1.
Change in PC responses during STSA. (A–C) Three examples of PC-SS and CS responses recorded during inward STSA. (D–F) Three examples of PC-SS and CS responses recorded during outward STSA. For each column, the peristimulus histograms (PSTH) represent the mean saccade-related activity of the cell at different times during STSA from the beginning (topmost) to the end (bottommost) of adaptation, each PSTH is based on 50 trials, as a function of the time relative to saccade onset (the vertical dashed line on each PSTH). The number given on top of each PSTH indicates the mean saccadic gain for the group of trials underlying the PSTH. For PCs 1, 2, 4, and 5, the bottommost row depicts the amplitude tuning of a neuron before (blue curve) and during (red curve) adaptation. The arrow indicates the course of adaptation. The CS responses were taken from a recent study on the influence of STSA on CS discharge patterns (20).
Fig. 2.
Fig. 2.
Effect of STSA on PC PB. (A) PB before STSA. PB plotted as a function of saccade time (x axis; 0, saccade onset) and duration (y axis), measured in discrete time steps (x axis: 1 ms, y axis: 2.5 ms). PBs during outward (B) and inward adaptation (C) were collected at a level of adaptation, when the gain change achieved lay between 5% and 10%; (D and E) PBs after stable outward (D) and inward adaptation (E) (gain change >15%). Black dashed, red, and yellow lines depict, respectively, saccade onset, saccade offset, and PB end.
Fig. 3.
Fig. 3.
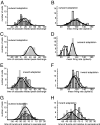
Distributions of times of peak discharge, mean spiking, rates, and times of burst offset for saccades before and at the end of adaptations. (A and B) Neurons tested for outward adaptation, showing a saccade-related burst before as well as at the end of adaptation (PCout-11). Distributions of time of peak discharge rates in milliseconds (A) and mean firing rate (B) before (white distributions and thin curves) and at the end (gray distributions and thick curves) of outward adaptation. (C and D) Neurons tested for outward adaptation, which did not exhibit any saccade-related burst before adaptation (PCout-01). Format as in A and B. (D) The white distribution and the thin curve plot the background activity of the PCout-01 before adaptation. (E and F) Neurons tested for inward adaptation(PCin). Format as in A and B. (G and H) Distributions of times of burst ends before (white distributions and thin curves) and at the end of adaptation (gray distributions and thick curves). (G) All neurons tested for outward adaptation (PCout-01 and PCout-11). (H) All neurons tested for inward adaptation.
Fig. 4.
Fig. 4.
Effect of STSA on saccade kinematics. (A) Example of eye position and eye velocity of saccades collected before (black curves) and at the end (colored curves) of adaptation. (B) Example of main sequence before vs. during adaptation; saccade duration and peak velocity are plotted as a function of saccade amplitude. The black curves represent the main sequence of saccades collected before adaptation, whereas the colored curves show saccades collected during adaptation (±SEM). A and B are based on the same dataset. (C) Percentage of change in saccade duration and peak of velocity as a function of gain change. Shown are the overall mean ±SEM of all adaptation sessions (82 adaptations in two monkeys) needed to record the 212 neurons considered in the analysis.
Fig. 5.
Fig. 5.
Profile of PC PB. (A) Mean velocity (±SE) profile of nonadapted 45 ms saccades (black) when compared with the mean velocity profile of adapted saccades after outward adaptation (red); the red bar above the profiles depicts the period when both profiles are significantly different (running paired t test, P < 0.0005, corrected for multiple comparison). As a consequence of outward adaptation, mean saccade duration increased from 45 to 58 ms. (B) Profile of SS population responses before adaptation of 45-ms-duration saccades (black curve), at the end of inward adaptation (blue curve), saccade duration still 45 ms, and outward adaptation (red curve) (saccade duration increase from 45 to 60 ms) relative to saccade onset. Means (±SE) are depicted.

References

    1. Marr D. A theory of cerebellar cortex. J Physiol. 1969;202:437–470. - PMC - PubMed
    1. Ito M. Cerebellar control of the vestibulo-ocular reflex—Around the flocculus hypothesis. Annu Rev Neurosci. 1982;5:275–296. - PubMed
    1. Albus JS. A theory of cerebellar function. Math Biosci. 1971;10:25–61.
    1. McLaughlin SC. Parametric adjustment in saccadic eye movements. Percept Psychophys. 1967;2:359–362.
    1. Barash S, et al. Saccadic dysmetria and adaptation after lesions of the cerebellar cortex. J Neurosci. 1999;19:10931–10939. - PMC - PubMed

Publication types

LinkOut - more resources