. 2008 Jul;18(7):1051-63.
doi: 10.1101/gr.076463.108. Epub 2008 May 13.

A high-resolution, nucleosome position map of C. elegans reveals a lack of universal sequence-dictated positioning

Affiliations

A high-resolution, nucleosome position map of C. elegans reveals a lack of universal sequence-dictated positioning

Anton Valouev et al. Genome Res. 2008 Jul.

Abstract

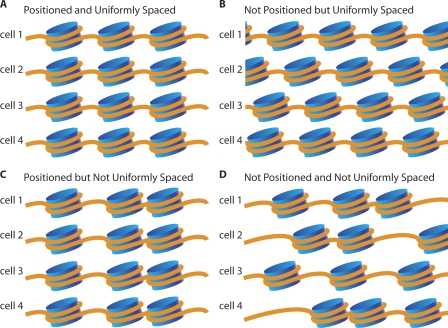
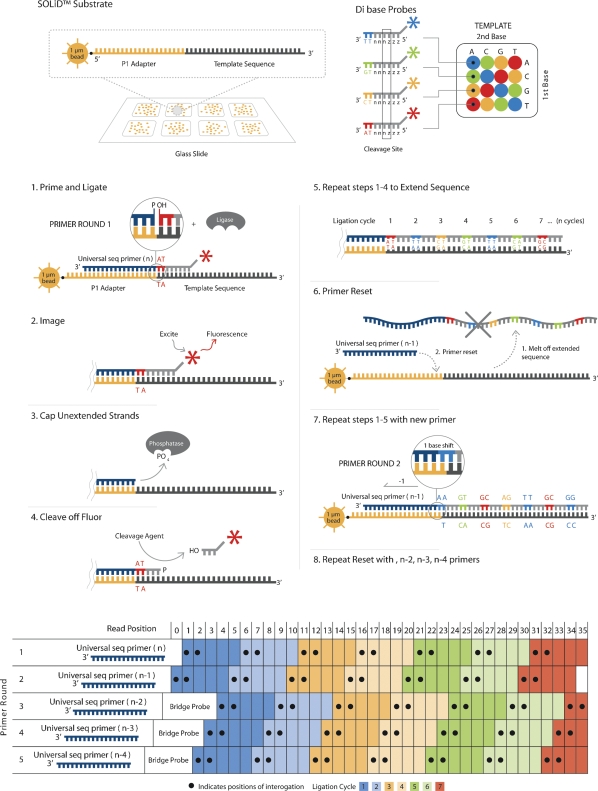
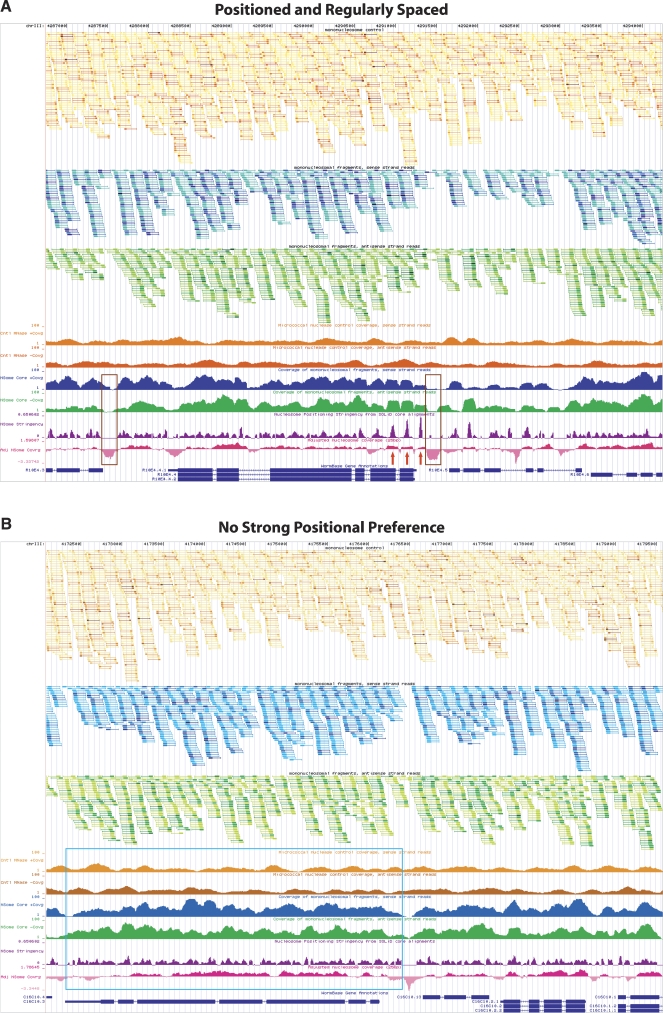
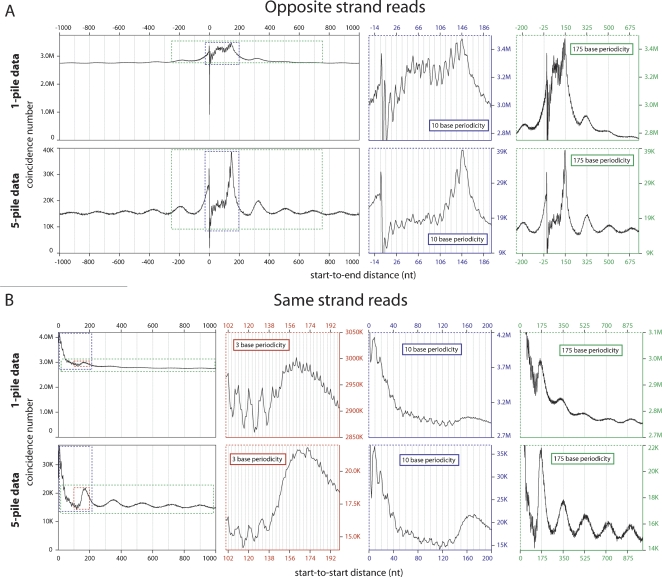
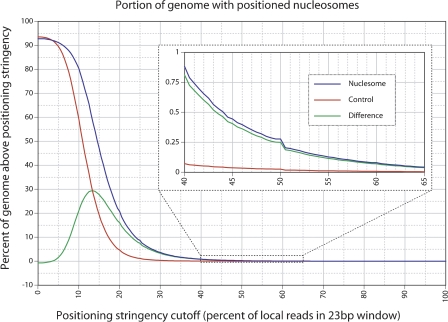
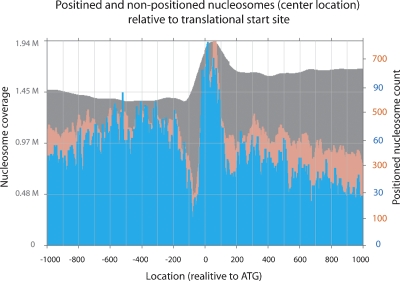
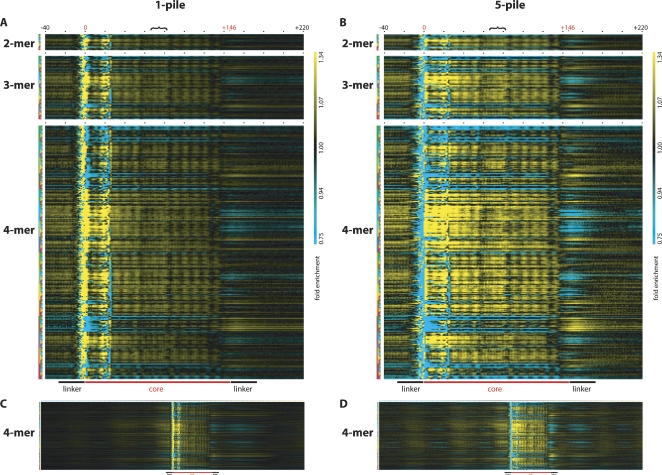
Using the massively parallel technique of sequencing by oligonucleotide ligation and detection (SOLiD; Applied Biosystems), we have assessed the in vivo positions of more than 44 million putative nucleosome cores in the multicellular genetic model organism Caenorhabditis elegans. These analyses provide a global view of the chromatin architecture of a multicellular animal at extremely high density and resolution. While we observe some degree of reproducible positioning throughout the genome in our mixed stage population of animals, we note that the major chromatin feature in the worm is a diversity of allowed nucleosome positions at the vast majority of individual loci. While absolute positioning of nucleosomes can vary substantially, relative positioning of nucleosomes (in a repeated array structure likely to be maintained at least in part by steric constraints) appears to be a significant property of chromatin structure. The high density of nucleosomal reads enabled a substantial extension of previous analysis describing the usage of individual oligonucleotide sequences along the span of the nucleosome core and linker. We release this data set, via the UCSC Genome Browser, as a resource for the high-resolution analysis of chromatin conformation and DNA accessibility at individual loci within the C. elegans genome.


Figures

Figure 1.
Figure 1.
Possible patterns of nucleosome positioning. Diagrams show four possible combinations for the local and relative position of nucleosomes. (A) Nucleosomes occupy reproducible positions in all cells and are regularly spaced relative to one another. (B) Nucleosomes are regularly spaced relative to one another, but have no strong tendency to occupy the same position in different cells. (C) Nucleosomes occupy the same position in all cells but are not regularly spaced relative to one another. (D) Nucleosomes neither occupy the same position in all cells nor have regular spacing relative to one another.
Figure 2.
Figure 2.
An outline of SOLiD sequencing technology.
Figure 3.
Figure 3.
UCSC Genome Browser displaying custom tracks of the Caenorhabditis elegans nucleosome position map. (A) Browser shot of the mcm-5 gene locus with several preferentially positioned nucleosomes in an organized array (red arrows). Nucleosome-depleted regions upstream of the ATG are highlighted by brown boxes, a common feature of many actively transcribed genes as noted by several groups (Yuan et al. 2005; Albert et al. 2007; Lee et al. 2007; Lin et al. 2007; Whitehouse et al. 2007; Schones et al. 2008; Shivaswamy et al. 2008; Yuan and Liu 2008). (B) A representative locus (displaying gene C16C10.3) in the genome demonstrating lack of nucleosome positioning particularly across a 3.5-kb stretch (highlighted by the blue box) possibly due to random nucleosome occupancy. In both A and B the top three tracks display raw data from control (orange) and nucleosome (forward blue and reverse green) experiments. Tracks two and three represent 147 nt stretches of putative nucleosome cores from forward (blue) and reverse (green) reads, with the first 50 sequenced nucleotides indicated by a thick portion of the track feature. Track one displays both forward and reverse control data (orange) in a similar fashion as the nucleosome data. The nucleosome core and genomic DNA control reads have been collapsed and colored such that multiple reads starting at the same nucleotide are represented by a single feature that varies in hue from lightest to darkest depending on the number of instances. Lightest to darkest hues correspond to the following categories: one read instance, two read instances, three to five instances, six to 10 instances, and >10 instances, respectively. Tracks four and five (coverage of nucleosome control, sense/antisense strand reads) display the coverage by 147 nt stretches from the control data. Tracks six and seven (coverage of mononucleosomal fragments, sense/antisense strand reads) show coverage by putative nucleosome cores inferred from reads that map to sense (blue) or antisense (green) strand of the reference genome. Track eight (purple) evaluates nucleosome positioning stringency at every base pair varying between 0 and 1, such that 1.0 corresponds to 100% positioning and 0.0 corresponds to no positioning or insufficient data. Track nine (adjusted nucleosome coverage, pink) displays nucleosome coverage (on a log2 scale) relative to control data to account for sequencing and enzymatic biases. Areas falling below 0.0 are on average more depleted for nucleosomes, while areas above 0.0 have increased frequency of nucleosome instances. ±1 indicates a twofold increase or depletion of putative nucleosome cores at that position.
Figure 4.
Figure 4.
Global analysis of positional relationships between individual pan-cellular and neighboring nucleosomes. (A) Start-to-End distances for reads mapped to opposite strands. The graph shows total pairs of nucleosomes with a Start-to-End distance corresponding to the value on the X-axis. The dominant peak corresponding to position 146 (the 147th base from the start of the read) demonstrates reproducible positioning of nucleosomes at the same loci across cells. The colored graphs to the right zoom in on the same data (areas demarked by colored dotted lines), but highlight the 175-base periodicity reflecting the phasing on neighboring nucleosomes (green graph) and the 10-base periodicity indicative of rotational positioning of nucleosomes (blue graph). (B) Start-to-Start distances of reads mapped to the same strand. The graph shows total pairs of nucleosomes with Start-to-Start distance corresponding to the value on the X-axis. A subtle broad peak is located at approximately base 175, with echoes of this peak at a periodicity of 175 bases (green graph). A 10-base periodicity (blue graph) is also seen extending out from the start site, but is somewhat obscured by an underlying 3-base periodicity (red graph). In A and B the top set of graphs are generated form the total data (1-pile data) and the bottom graphs are generated from data enriched for positioned nucleosomes (5-pile data). This enrichment results in a greater relative amplitude of the major signal for reproducibility in absolute nucleosome positioning (A, bottom graph, major peak at 146) and in relative positioning (A,B, bottom, green graphs), but slightly decreases the resolution of the 10-base periodicity (A,B, bottom, blue graphs) and makes the 3-base periodicity (B, bottom, red graph) less prominent due to greater noise in the signal from the smaller data set (only 1/28th the size of nonenriched data set).
Figure 5.
Figure 5.
Portion of the C. elegans genome with positioned nucleosomes. The percent of the genome (vertical axis) that falls above as specified positioning stringency cutoff (horizontal axis). The blue line is obtained from the nucleosome data, the red line is obtained from the negative control non-nucleosomal data (background), and the green line indicates the difference between the two (net positioning). The inset graph is the same data expanded between the 40% and 65% stringency cutoff levels.
Figure 6.
Figure 6.
Positioned nucleosomes relative to the translation start site. Using the positioned nucleosome data from 20% (pink) and 33% (blue) positioning stringency cutoffs, the number of positioned nucleosome dyads (vertical axis) is plotted relative to the ATG of the translational start sites of all annotated RefSeq genes (UCSC genome browser) (horizontal axis). The gray plot in the background depicts the nucleosome coverage from the complete data relative to ATG over the entire genome.
Figure 7.
Figure 7.
Over- and under-representation of oligonucleotide words in and around nucleosome cores. The over- (yellow) and under-representation (cyan) of k-mer words in the nucleosome core is displayed for every position within the core. Each column represents the position in or around the nucleosome core starting with the position 40 nt upstream and ending with the position 220 nt downstream of the start position of the core as indicated by the black numbers −40 and +220. The putative start and end positions of the core are indicated with the red numbers 0 and +146, respectively, and black dots demark positions 20 nt apart, and the black bracket indicates the position of the putative nucleosome dyad. Each row represents one of the 16 possible 2-mers, 64 possible 3-mers, and 256 possible 4-mers, with the k-mer key to the left representing A in green, C in blue, G in yellow, and T in red. Thus, the key for the first row indicates AA as two green boxes, the second row indicates AC as a green, and then a blue box, the third row indicates AG as a green and then a yellow box, the fourth row indicates AT as a green and then a red box, etc. The over- or under-representation of each dinucleotide may be assessed at any position in or around the nucleosome core by looking at the intersection of any column (position relative to the start of the nucleosome core) and any row (individual dinucleotide word) with the color indicating over- (yellow) or under-representation (cyan) relative to the control value (black indicating no enrichment over sequenced control DNA). (A,B) The same depiction of data derived from the 1-pile or 5-pile data sets, respectively. (C,D) The same 4-mer analysis as in A and B expanded to show 500 positions both upstream and downstream of the nucleosome core start site. The magnification in C and D is reduced to allow visualization of all the positions. In all panels, the fold enrichment scale is the same ranging from 0.75- to 1.34-fold enrichment, and the color range is shown to the far right of A and B. Additionally, a cartoon depiction of the position of the nucleosome core along with the linker region relative to the graphical data is displayed at the bottom of A and B and at the bottom of C and D, scaled for panels. In all panels, sequencing and enzymatic biases affect the representation of k-mer words between positions −10 and +25, while the rest of the plot is expected to be free of these biases.

References

    1. Albert I., Mavrich T.N., Tomsho L.P., Qi J., Zanton S.J., Schuster S.C., Pugh B.F. Translational and rotational settings of H2A.Z nucleosomes across the Saccharomyces cerevisiae genome. Nature. 2007;446:572–576. - PubMed
    1. Blumenthal T. Trans-splicing and polycistronic transcription in Caenohabditis elegans. Trends Genet. 1995;11:132–136. - PubMed
    1. Davey C.A., Sargent D.F., Luger K., Maeder A.W., Richmond T.J. Solvent mediated interactions in the structure of the nucleosome core particle at 1.9 Å resolution. J. Mol. Biol. 2002;319:1097–1113. - PubMed
    1. Dixon D.K., Jones D., Candido E.P. The differentially expressed 16-kD heat shock genes of Caenorhabditis elegans exhibit differential changes in chromatin structure during heat shock. DNA Cell Biol. 1990;9:177–191. - PubMed
    1. Dressman D., Yan H., Traverso G., Kinzler K.W., Vogelstein B. Transforming single DNA molecules into fluorescent magnetic particles for detection and enumeration of genetic variations. Proc. Natl. Acad. Sci. 2003;100:8817–8822. - PMC - PubMed

Publication types

LinkOut - more resources