

Pointed wings, low wingloading and calm air reduce migratory flight costs in songbirds
- PMID: 18478072
- PMCID: PMC2364644
- DOI: 10.1371/journal.pone.0002154
Pointed wings, low wingloading and calm air reduce migratory flight costs in songbirds
Abstract
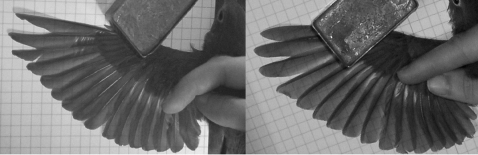
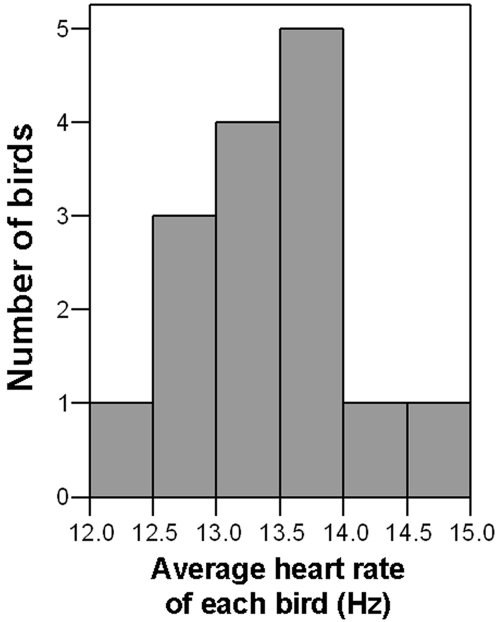
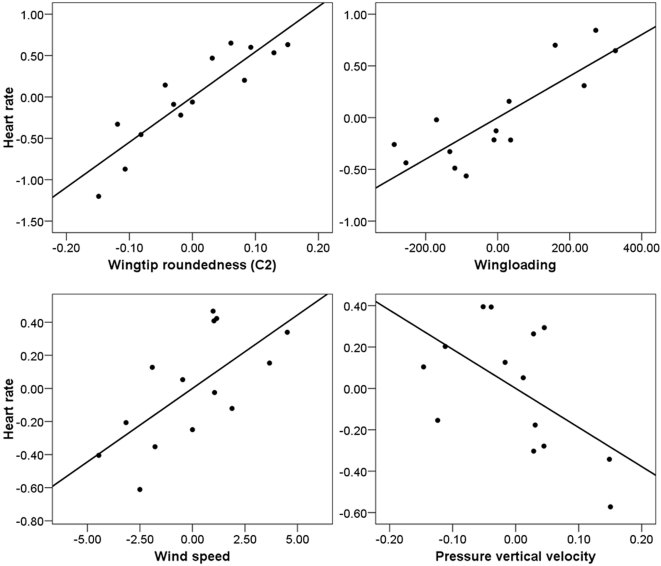
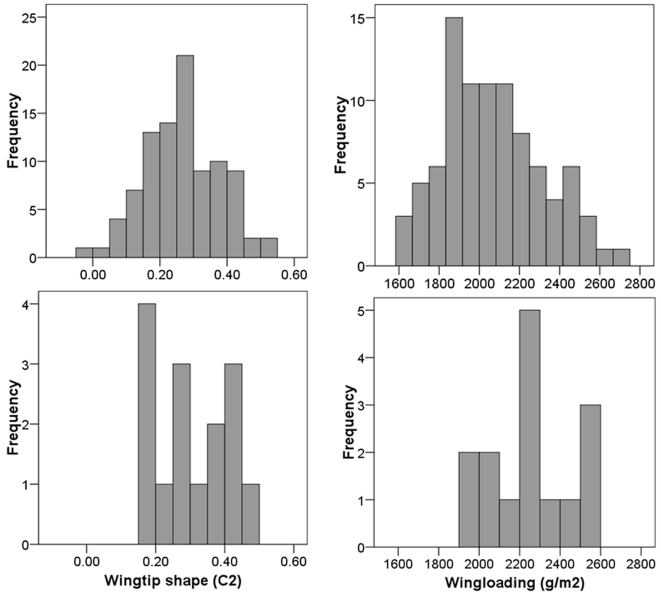
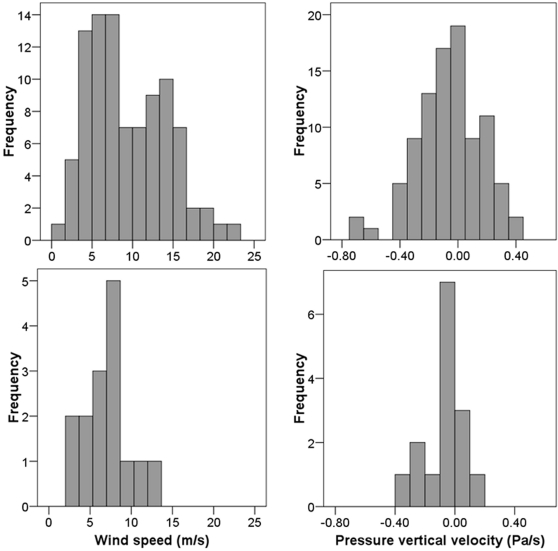
Migratory bird, bat and insect species tend to have more pointed wings than non-migrants. Pointed wings and low wingloading, or body mass divided by wing area, are thought to reduce energy consumption during long-distance flight, but these hypotheses have never been directly tested. Furthermore, it is not clear how the atmospheric conditions migrants encounter while aloft affect their energy use; without such information, we cannot accurately predict migratory species' response(s) to climate change. Here, we measured the heart rates of 15 free-flying Swainson's Thrushes (Catharus ustulatus) during migratory flight. Heart rate, and therefore rate of energy expenditure, was positively associated with individual variation in wingtip roundedness and wingloading throughout the flights. During the cruise phase of the flights, heart rate was also positively associated with wind speed but not wind direction, and negatively but not significantly associated with large-scale atmospheric stability. High winds and low atmospheric stability are both indicative of the presence of turbulent eddies, suggesting that birds may be using more energy when atmospheric turbulence is high. We therefore suggest that pointed wingtips, low wingloading and avoidance of high winds and turbulence reduce flight costs for small birds during migration, and that climate change may have the strongest effects on migrants' in-flight energy use if it affects the frequency and/or severity of high winds and atmospheric instability.
Conflict of interest statement
Figures
References
-
- Wikelski M, Tarlow EM, Raim A, Diehl RH, Larkin RP, et al. Costs of migration in free-flying songbirds. Nature. 2003;423:704. - PubMed
-
- Cochran WW, Wikelski MC. Individual migratory tactics of New World Catharus thrushes: Current knowledge and future tracking options from space. In: Greenberg R, Marra PP, editors. Birds of two worlds: The ecology and evolution of migration. Baltimore: Johns Hopkins University Press; 2005. pp. 274–289.
-
- Lockwood R, Swaddle JP, Rayner JMV. Avian wingtip shape reconsidered: Wingtip shape indices and morphological adaptations to migration. J Avian Biol. 1998;29:273–292.
-
- Winkler H, Leisler B. To be a migrant: Ecomorphological burdens and chances. In: Greenberg R, Marra PP, editors. Birds of two worlds: The ecology and evolution of migration. Baltimore: Johns Hopkins University Press; 2005. pp. 79–86.
-
- Norberg UM. Vertebrate flight. New York: Springer Verlag; 1990. p. 291.
Publication types
MeSH terms
LinkOut - more resources
Full Text Sources
