. 2008 May 14;3(5):e2145.
doi: 10.1371/journal.pone.0002145.

Highly conserved regimes of neighbor-base-dependent mutation generated the background primary-structural heterogeneities along vertebrate chromosomes

Affiliations

Highly conserved regimes of neighbor-base-dependent mutation generated the background primary-structural heterogeneities along vertebrate chromosomes

Marcos A Antezana et al. PLoS One. .

Erratum in

  • PLoS One. 2013;8(9). doi:10.1371/annotation/bc789a4f-9fb7-41df-bc6f-d26203d09dbe

Abstract

The content of guanine+cytosine varies markedly along the chromosomes of homeotherms and great effort has been devoted to studying this heterogeneity and its biological implications. Already before the DNA-sequencing era, however, it was established that the dinucleotides in the DNA of mammals in particular, and of most organisms in general, show striking over- and under-representations that cannot be explained by the base composition. Here we show that in the coding regions of vertebrates both GC content and codon occurrences are strongly correlated with such "motif preferences" even though we quantify the latter using an index that is not affected by the base composition, codon usage, and protein-sequence encoding. These correlations are likely to be the result of the long-term shaping of the primary structure of genic and non-genic DNA by a regime of mutation of which central features have been maintained by natural selection. We find indeed that these preferences are conserved in vertebrates even more rigidly than codon occurrences and we show that the occurrence-preference correlations are stronger in intronic and non-genic DNA, with the R(2)s reaching 99% when GC content is approximately 0.5. The mutation regime appears to be characterized by rates that depend markedly on the bases present at the site preceding and at that following each mutating site, because when we estimate such rates of neighbor-base-dependent mutation (NBDM) from substitutions retrieved from alignments of coding, intronic, and non-genic mammalian DNA sorted and grouped by GC content, they suffice to simulate DNA sequences in which motif occurrences and preferences as well as the correlations of motif preferences with GC content and with motif occurrences, are very similar to the mammalian ones. The best fit, however, is obtained with NBDM regimes lacking strand effects, which indicates that over the long term NBDM switches strands in the germline as one would expect for effects due to loosely contained background transcription. Finally, we show that human coding regions are less mutable under the estimated NBDM regimes than under matched context-independent mutation and that this entails marked differences between the spectra of amino-acid mutations that either mutation regime should generate. In the Discussion we examine the mechanisms likely to underlie NBDM heterogeneity along chromosomes and propose that it reflects how the diversity and activity of lesion-bypass polymerases (LBPs) track the landscapes of scheduled and non-scheduled genome repair, replication, and transcription during the cell cycle. We conclude that the primary structure of vertebrate genic DNA at and below the trinucleotide level has been governed over the long term by highly conserved regimes of NBDM which should be under direct natural selection because they alter drastically missense-mutation rates and hence the somatic and the germline mutational loads. Therefore, the non-coding DNA of vertebrates may have been shaped by NBDM only epiphenomenally, with non-genic DNA being affected mainly when found in the proximity of genes.


Conflict of interest statement

Competing Interests: The authors have declared that no competing interests exist.

Figures

Figure 1
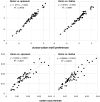
Figure 1. Human codon occurrences and trinucleotide-motif preferences.
On the top left are the total occurrences of the 61 non-stop codons in 33,860 human coding regions (CDSs; vertical axis) plotted against the average across-codon over-/under-representation of (“preference for”) the corresponding 61 trinucleotide motifs in the same CDSs (horizontal axis). The average preference for a motif is the average over all CDSs of the Z value for the motif's 23∥1+3∥12 “off-frame” count in each CDS, where the set of 61 Z values of each CDS is estimated using 10,000 randomizations of the locations of its synonymous codons (SCs; see M&Ms). Grey dots are for “null” motifs preferences obtained by randomizing each CDS' SC locations before estimating each CDS' motif preferences and averaging over CDSs. The other plots highlight motif groups defined by the genetic code's degeneracy. In the 2-folds plot (top middle) the “minus outlayers” R2 and slope are for the “3f -3aas” group created by excluding the codons of three outlayer 2fold families (solid circles; see text).
Figure 2
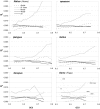
Figure 2. The conservation of codon occurrences and trinucleotide-motif preferences in homeotherm vertebrates.
Plots of the preferences for across-codon trinucleotides in Homo vs. opossum or Gallus (left and right, top) and of whole-genome codon occurrences in Homo vs. opossum or Gallus (left and right, bottom). Homo's values are on the horizontal axis.
Figure 3
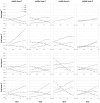
Figure 3. Codon occurrences vs. trinucleotide-motif preferences as a function of GC content.
At the top are plotted the R2s and the slopes of the correlations between codon occurrences and corresponding motif preferences for given values of 3rd-position GC content (GC3). The other plots show the situation at the GC3 values delivering peak R2s for, clockwise, 2 fold, 2fold-3aas, 4fold, and 6fold codons/motifs (i.e., 0.67, 0.55, 0.46, and 0.51 GC3; the GC3 delivering the peak all-motifs R2 coincides with that of 2folds-3aas; see also Figure 1). The 33,860 human coding regions were sorted according to 3rd-position GC content and subdivided into 13 groups of equal size.
Figure 4
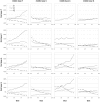
Figure 4. Occurrence-vs.-preference R2s in vertebrates as a function of GC3.
The R2s of the correlation between codon occurrences and corresponding off-frame-motif preferences for increasing GC3 values in the genomes of Rattus, opossum, platypus, Gallus, Xenopus, and Danio. In the Rattus plot the Homo patterns from Fig. 3 are used as background and Fugu's are in the background in the Danio plot.
Figure 5
Figure 5. Occurrence-preference slopes in vertebrates as a function of GC3.
The slopes of the correlation between codon occurrences and corresponding motif preferences for increasing GC3 values in the genomes of Rattus, opossum, platypus, Gallus, Xenopus, Danio, and Fugu. In the Rattus plot the Homo patterns from Fig. 3 are used as background and Fugu's are in the background in the Danio plot.
Figure 6
Figure 6. Coding-region GC vs. “GC-vs.-AT pressures” derived from motif preferences.
The correlation between the GC content at the three codon positions of human genes and the sum of the preferences for across-codon trinucleotides weighted by their GC content at relevant places (see Methods). Solid dots are for the 33,860 human coding regions which were sorted by increasing GC content at the relevant codon position(s) and subdivided into 13 groups of equal size; +'s are for the 12,717 human genes with known mouse homologues. The thick horizontal grey lines are for a “null” data set created by randomizing the location of SCs in each of the 33.860 sequences before estimating motif preferences.
Figure 7
Figure 7. Vertebrate GC3 vs. GC3-pressures derived from motif preferences.
The correlation between coding-region GC content (GC123) and the corresponding GCvsAT pressure derived from motif preferences. Clockwise from the top left are results for opossum and Rattus (+), platypus, Gallus and Xenopus (+), and Fugu and Danio (+). The thick gray lines are for human genes. See also Methods and the previous figure.
Figure 8
Figure 8. Vertebrate 3rd-position GC content and dinucleotide-motif preferences.
The correlation in human coding regions between 3rd-position GC content and the GCvsAT pressure derived from dinucleotide-motif preferences (see also Methods and previous figures).
Figure 9
Figure 9. Coding-region GC content in vertebrates.
The distribution of the GC content at the three codon positions in vertebrate genes. Thickest black line: first-position GC content (GC1); 2nd-thickest black line: GC2; thin black line: GC3; circles: GC123. Lighter lines and circles are for Rattus, platypus, and Danio, respectively.
Figure 10
Figure 10. The non-randomness of motif preferences as a function of GC content.
The correlation between GC3 in human genes and the sum of all the over-representations of tri- or dinucleotide motifs (left, right). The gray lines are the patterns from the null human data set. Note that using the sum of the absolute value of every motif preference delivers lower R2s of 53.6 and 84.3%.
Figure 11
Figure 11. The occurrence frequency of the 61 sense codons as a function of increasing 3rd-position GC content.
In each plot the third base is labelled as in the top left (stop codons not shown).
Figure 12
Figure 12. The across-codon preferences for the 64 trinucleotide motifs as a function of increasing GC3.
In each plot the third base is labelled as in the top left.
Figure 13
Figure 13. GC content and the departure of codon occurrences from base-composition expectations.
The difference between the occurrence of each of the 61 sense codons from the occurrence expected given the base composition that best fits the total codon occurrences in each GC3-sorted group of coding regions, plotted by increasing GC3. In each plot the third base is labelled as in the top left.
Figure 14
Figure 14. Dinucleotide occurrences and preferences as a function of GC content.
From top to bottom are the occurrence frequency of the 16 across-codon (3∥1) dinucleotides, their departure from the expectation given the base composition that best fits codon occurrences (divided by the expectation), and their across-codon preferences, as a function of increasing GC3.
Figure 15
Figure 15. Transcribed-strand asymmetries as a function of GC3.
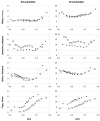
The sum within each GC-sorted gene group of the absolute values of the differences (deltas) between values for complementary bases, 3|1 dinucleotides, and trinucleotides (top, middle, and bottom). At the top left are overall base-occurrence asymmetries at each codon position and on the right the TvsA and CvsG individual deltas. Also shown are base-composition predictions for all genes and asymmetries in 90 ribosomal-protein genes (subdivided into 6 groups, white signs, left plot only). In the middle and bottom are occurrence asymmetries and motif-preference asymmetries (left, right), for 3|1 dinucleotides and for codons or across-codon trinucleotides (see also Figure 16 and 17 for individual-motif deltas). Grey lines on the left are the base-composition expectations and on the right the “null” asymmetries of motif preferences from genes with previously randomized synonymous-codon locations. The +signs are for ribosomal-protein genes and the white +'s are the base-composition predictions.
Figure 16
Figure 16. Transcribed-strand asymmetries of the occurrences and preferences of complementary 3|1 dinucleotides as a function of GC3.
For each GC-sorted gene group, the asymmetries within each of the six pairs of non-identical complementary dinucleotides are expressed as the signed difference (delta) between the values of pair members. Clockwise from the top left: deltas for occurrence frequencies, for 1-composition expectations, for motif preferences, and for the difference between observed and expected occurrence deltas. In all plots pairs are labelled as in the upper right plot (where ct-ag hides tc-ga, however).
Figure 17
Figure 17. Transcribed-strand asymmetries of complementary trinucleotides as a function of GC3.
From the top and for every GC-sorted gene group, the asymmetry of codon occurrences expressed as the signed difference (delta) between the frequencies of complementary codons, between expected occurrences (i.e., expected given the base composition that best fits codon occurrences), between observed and expected occurrence deltas, and between motif preferences. Occurrence asymmetries involving stop codons are not shown.
Figure 18
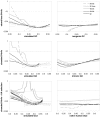
Figure 18. Strand asymmetries of the occurrences in vertebrate coding regions of mono-, di-, and tri-nucleotides as a function of GC3.
Plotted is the sum within each GC-sorted gene group of the absolute value of the difference between the occurrence frequencies of each pair of complementary bases, dinucleotides, or trinucleotides (top to bottom). Solid symbols are for Homo, platypus, and Danio.
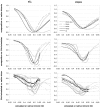
Figure 19
Figure 19. Transcribed-strand asymmetries in vertebrate genomes of motif preferences as a function of increasing GC content.
The sum within each GC-sorted gene group of the absolute values of the differences between the motif preferences for complementary across-codon dinucleotides or trinucleotides (left, right). The solid dots are for Homo, platypus, Xenopus, and Danio.
Figure 20
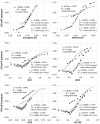
Figure 20. Preferences and occurrences in coding vs. intronic DNA.
The correlation of motif preferences or occurrences (left, right) in the human coding-region dataset (vertical axis) with those in the human intronic DNA dataset (horizontal axis). Also shown are the correlations of intronic-DNA values with values obtained from the whole-genome dinucleotide data from human spleen cells tabulated in Setlov (1976; bottom plots, plus signs, vertical axis; see also methods and Figure 21) where Setlov's motif “preferences” are the chi values given the base composition implied by the dinucleotide occurrences.
Figure 21
Figure 21. Preferences and occurrences in coding and intronic DNA vs. in non-genic DNA.
The correlation between motif preferences and occurrences (left, right) in non-genic DNA (horizontal axis) vs. those in coding and intronic DNA (vertical axis, empty and solid circles). Pluses on the top right are for across-codon motif occurrences (23|1+3|12; vertical axis) and, in the bottom plots, for the dinucleotide occurrences in human spleen cells tabulated in Setlov (1976; left, vertical axis) and for the corresponding chi values derived from Setlov's dinucleotide occurrences (right, vertical axis). See also Methods and Figure 20.
Figure 22
Figure 22. Trinucleotide preference-occurrence correlations in non-genic and intronic DNA vs. GC content.
About 4,700 human nongenic DNA sequences and 54,000 human introns, sorted by increasing GC content and subdivided into 13 groups of equal size. On the top are the occurrence-preference R2s within each GC-defined group of nongenic and intron sequences. In the middle are plots of trinucleotide occurrence against motif preferences for the GC groups that gave highest occurrence-preference R2s (49% non-genic GC and 51% intronic GC). At the bottom are the correlations between the GC content and the difference between the sums of the preferences for trinucleotides containing CorG and TorA (see M&Ms).
Figure 23
Figure 23. Slopes of the trinucleotide preference-occurrence correlations in non-genic and intronic DNA vs. GC content.
From top to bottom: the slopes of the occurrence-preference correlation between trinucleotide-motif preferences and occurrences in groups of nongenic, intronic, and coding DNA of increasing GC (R2s are shown in the figure 22 and Figure 3).
Figure 24
Figure 24. Trinucleotide preferences and occurrences in coding, intronic, and non-genic DNA.
The right half of the figure shows from top to bottom the occurrence-occurrence R2s for trinucleotides from coding vs. intronic DNA, coding vs. non-genic DNA, and non-genic vs. intronic DNA, as a function of increasing GC content (horizontal axis); flanked to the left by the corresponding preference-preference R2s for off-frame trinucleotides. The figure's left half shows the corresponding slopes. For the top two rows we used human whole-genome coding-region values (and codons were used as “coding-region trinucleotides”); and for the bottom row we used values from the 49%-GC non-genic subgroup.
Figure 25
Figure 25. Simulated occurrence-preference R2s as a function of GC content.
On the left are the occurrence-preference R2s (vertical axis) for trinucleotides in groups of 1000 simulated sequences whose every site was hit at least ten times with 64×4 matrices estimated from Homo-chimp/macaque intron alignments of increasing GC, plotted against the GC of the simulated sequences (horizontal axis). At the top left are results with 64×4s lacking strand effects (i.e., complementary substitutions were pooled to estimate rates) in absence of selection, flanked by the human non-genic pattern. In the middle on the left are results with 64×4s with full strand effects and no selection, flanked by the pattern of human introns. At the bottom left are results with Grantham non-synonymous selection (see M&Ms) and 64×4s with and without strand effects (thicker and thickest lines), flanked by the pattern of human coding DNA. Additionally, in thinnest lines on the left, are results with 64×4s from human-chimp/baboon non-genic DNA (top; highest GC: 0.48) or with 64×4s from mouse-rat/Homo coding-DNA alignments (middle and bottom; bottom is vs. GC123 which had wider GC excursion). The intronic 64×4 matrix that generated the two no-selection GCs of 0.408 and the GC3 of 0.42 was estimated on the basis of 2.9 million substitutions to human or chimp.
Figure 26
Figure 26. Simulated occurrence-preference slopes as a function of GC content.
On the vertical axis is the slope of the correlation between average trinucleotide preferences and total trinucleotide occurrences as a function of increasing GC content (horizontal axis). On the right are the native patterns and on the left are those from simulated data. The data sets are the same as in the previous figure and are labelled identically. In plots with log vertical axis, the missing stretches of curves are due to negative slopes.
Figure 27
Figure 27. Simulated relationship between GC content and GCvsAT pressures derived from trinucleotide-motif preferences.
The patterns were obtained from sequences generated by 64×4 substitution matrices derived from non-genic, coding, and intronic DNA alignments (solid, solid, and empty circles). The top plots show the pattern generated in absence of selection by the 64×4s derived from non-genic and coding-region DNA (left, right, solid circles), and by intronic 64×4s with and without strand effects (left, right, empty circles), the thick grey lines being the native non-genic and intronic human patterns (left, right). The middle and bottom plots show the patterns generated under Grantham non-synonymous selection, where grey lines are the mouse native patterns and smaller and larger empty circles label the results obtained from matrices with and without strand effects, respectively. The simulated data are otherwise the same as in the previous figure (see also Methods).
Figure 28
Figure 28. Trinucleotide occurrences in native and simulated intronic DNA vs. base-composition expectations, as a function of GC content.
R2s and slopes (left, right; vertical axis) of the correlations between native or simulated intronic trinucleotide occurrences (top, middle) and their base-composition expectations, as a function of increasing GC content (horizontal axis; see also Methods). The simulated occurrences come from sequences generated by the intron- and coding-region-derived 64×4 matrices used for the previous figures (thicker and thinner lines, respectively). At the bottom are the R2s and slopes between native intronic values and the ones generated by 64×4 matrices. Thickest lines in the bottom plots indicate results with intronic 64×4s lacking strand effects.
Figure 29
Figure 29. Codon occurrences in native vs. simulated coding DNA, as a function of GC content.
The R2s and slopes (top, bottom; vertical axis) of the correlations between codon occurrences in native human genes and in simulated coding DNA generated by 4×4 or 64×4 matrices (left, right) with erased strand effects estimated from human-chimp/macaque intron alignments under Grantham selection of non-synonymous changes, as a function of increasing GC total (horizontal axis). Thinner-line patterns are for mouse genes and full-strand-effects 64×4s derived from mouse-rat/human coding-DNA alignments (leaning right). The fit with intronic 64×4s having full strand effects was worse.
Figure 30
Figure 30. Trinucleotide occurrences in native vs. simulated non-genic DNA as a function of GC content.
The R2s and slopes (top, bottom; vertical axis) of the correlations between trinucleotide occurrences in human non-genic DNA and the corresponding occurrences in simulated DNA (left) generated by no-strand-effects 64×4 matrices estimated from human-chimp/macaque intron-DNA alignments, as a function of increasing GC total (horizontal axis). The thinner-line patterns were generated by no-strand-effects 64×4 matrices from human-chimp/baboon non-genic DNA alignments. On the left are results with occurrences derived from the base composition that best fits the human non-genic occurrences vs. the native occurrences (the fit with the corresponding 4×4 matrices was slightly worse).
Figure 31
Figure 31. Dinucleotide occurrences in native vs. simulated non-genic, intronic, and coding DNA as a function of GC content.
The R2s and slopes (left, right, vertical axis) of the correlations of dinucleotide occurrences in native non-genic, intronic, and coding DNA (top to bottom) vs. those in simulated DNA generated by 4×4 (grey lines) or 64×4 matrices (black lines) estimated from non-genic, intronic, and coding-region substitutions, as a function of increasing GC total or GC123 (horizontal axis; but the grey-line results in the top two plots were obtained using base-composition predictions rather than simulated occurrences). Thick lines are results with intron-derived matrices and thinner lines in the top plots are results with non-genic-DNA matrices and –in the middle and bottom plots– results with coding-DNA matrices. The intron-derived 64×4s used for the top and bottom plots had no strand effects and so were those for the middle-plot results highlighted with the thickest black line.
Figure 32
Figure 32. Trinucleotide-motif preferences in native vs. simulated DNA as a function of GC content.
R2s and slopes (left, right; vertical axis) of the correlations of trinucleotide-motif preferences in native non-genic DNA, intronic DNA, and coding regions (top, middle, bottom) with motif preferences estimated from sequences generated by 64×4 matrices inferred from non-genic Homo-chimp/baboon substitutions (top; thin lines), from mouse-rat/Homo coding-region substitutions (middle, bottom; thin lines), and from no-strand-effect intronic matrices (top, thicker lines) and full-strand-effects intronic matrices (middle, bottom; thicker lines), as a function of increasing GC total or GC123 (horizontal axis). Simulations for the bottom plots included Grantham selection of generated non-synonymous changes.
Figure 33
Figure 33. Dinucleotide preferences in native vs. simulated DNA as a function of GC content.
The R2s and slopes (left, right, vertical axis) of the correlation of dinucleotide preferences in native coding, intronic, and non-genic DNA (black, grey, and segmented grey, respectively) vs. those in DNA simulated using 64×4 matrices estimated from non-genic, coding-region, and intronic substitutions (thin segmented line; solid grey and black thin lines; and all thicker lines, respectively, as a function of increasing GC total (horizontal axis; but the thin black dotted lines are for 3∥1 dinucleotides simulated using intronic 64×4s with erased strand effects; the fit to intronic and non-genic dinucleotides with intronic 64×4s lacking strand effects was almost identical as with full strand effects). Coding-region preferences for 3∥1 dinucleotides were estimated from sequences simulated under Granthamian amino-acid selection.
Figure 34
Figure 34. The mutability of human coding regions under empirically estimated 64×4 and 4×4 mutation.
The top plots show the sum of the mutation rates at every base in all the human coding regions whose GC123 matches to ±0.01 the GC123 generated by the intronic or coding-region-derived 64×4 matrices used for the previous figures (bigger and smaller symbols), divided by the total number of bases evaluated and then by the corresponding value obtained with each matched 4×4 matrix. From left to right are the sums of the rates of every possible one-base mutation at every codon position and at first, second, and third positions separately. The bottom three rows of plots show the potential deleteriousness of the same 64×4 regimes evaluated according to either the Grantham, the EX, or the Blosum100 amino-acid-distance matrix (from top to bottom), again relative to the values under matched 4×4 mutation. The 20×20 replacement mutabilities were each multiplied by its corresponding value in the 20×20 distance matrix, the 20×20 products were summed, and this sum was then divided by the corresponding 4×4 sum (see Results).
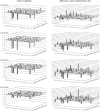
Figure 35
Figure 35. The expected incidence of amino-acid replacements due to one-base codon mutations in human coding regions, under 64×4 relative to 4×4 intronic mutation.
Results from top to bottom are for 0.34, 0.42, 0.50, and 0.57 GC123 (i.e., points 2, 8, 14, and 17 from the left in Fig. 34). A positive value on the left indicates that the 64×4 mutability is (value +1.0)-fold higher than it 4×4 counterpart (1.0 was substracted to obtain 0.0 when two rates are identical); and a negative value indicates that the 4×4 value is abs(value −1.0)-fold higher than its 64×4 counterpart. On the right are the differences between each plain replacement mutability under 64×4 mutation and its 4×4 counterpart, to highlight the replacement dominating the patterns in Figure 34. Values on the right were rescaled to make the largest positive difference equal to 5.0 (i.e., the 245.7 Arg –>Gln rate). Therefore, values above the 0.0-plane, both left and right, indicate an advantage for NBDM (i.e., a 64×4 mutability lower than its 4×4 counterpart). Numeric values are shown in Figure 36.
Figure 36
Figure 36. The expected incidence in human coding regions of the amino-acid replacements due to one-base point mutations under intronic 64×4 vs matched 4×4 mutation.
Dark cells highlight low 64×4 values and light cells with boldface highlight high 64×4 values (details in Figure 35).

Similar articles

Cited by

References

    1. Bernardi G. The compositional evolution of vertebrate genomes. Gene. 259((1–2)):31–43. - PubMed
    1. Bernardi G. Structural and Evolutionary Genomics - Natural Selection in Genome Evolution. Elsevier Science; 2005.
    1. King JL, Jukes TH. Non-Darwinian evolution. Science. 1969;164:788–798. - PubMed
    1. Antezana MA, Kreitman M. The nonrandom location of synonymous codons suggests that reading frame-independent forces have patterned codon preferences. Journal of Molecular Evolution. 1999;49((1)):36–43. - PubMed
    1. Nussinov R. Eukaryotic dinucleotide preference rules and their implications for degenerate codon usage. J Mol Biol. 1981a;149((1)):125–31. - PubMed