

Real time bayesian estimation of the epidemic potential of emerging infectious diseases
- PMID: 18478118
- PMCID: PMC2366072
- DOI: 10.1371/journal.pone.0002185
Real time bayesian estimation of the epidemic potential of emerging infectious diseases
Abstract
Background: Fast changes in human demographics worldwide, coupled with increased mobility, and modified land uses make the threat of emerging infectious diseases increasingly important. Currently there is worldwide alert for H5N1 avian influenza becoming as transmissible in humans as seasonal influenza, and potentially causing a pandemic of unprecedented proportions. Here we show how epidemiological surveillance data for emerging infectious diseases can be interpreted in real time to assess changes in transmissibility with quantified uncertainty, and to perform running time predictions of new cases and guide logistics allocations.
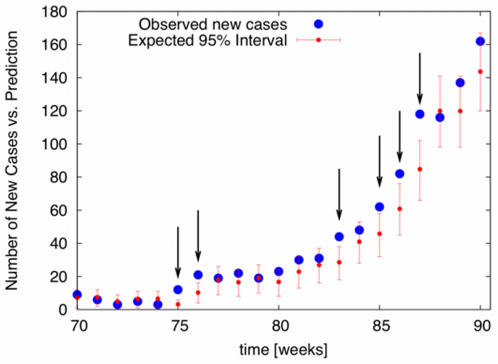
Methodology/principal findings: We develop an extension of standard epidemiological models, appropriate for emerging infectious diseases, that describes the probabilistic progression of case numbers due to the concurrent effects of (incipient) human transmission and multiple introductions from a reservoir. The model is cast in terms of surveillance observables and immediately suggests a simple graphical estimation procedure for the effective reproductive number R (mean number of cases generated by an infectious individual) of standard epidemics. For emerging infectious diseases, which typically show large relative case number fluctuations over time, we develop a bayesian scheme for real time estimation of the probability distribution of the effective reproduction number and show how to use such inferences to formulate significance tests on future epidemiological observations.
Conclusions/significance: Violations of these significance tests define statistical anomalies that may signal changes in the epidemiology of emerging diseases and should trigger further field investigation. We apply the methodology to case data from World Health Organization reports to place bounds on the current transmissibility of H5N1 influenza in humans and establish a statistical basis for monitoring its evolution in real time.
Conflict of interest statement
Figures


Similar articles
-
Modelling H5N1 in Bangladesh across spatial scales: Model complexity and zoonotic transmission risk.Epidemics. 2017 Sep;20:37-55. doi: 10.1016/j.epidem.2017.02.007. Epub 2017 Feb 21. Epidemics. 2017. PMID: 28325494
-
Transmissibility of the highly pathogenic avian influenza virus, subtype H5N1 in domestic poultry: a spatio-temporal estimation at the global scale.Geospat Health. 2012 Nov;7(1):135-43. doi: 10.4081/gh.2012.112. Geospat Health. 2012. PMID: 23242687
-
Bayesian estimation of the effective reproduction number for pandemic influenza A H1N1 in Guangdong Province, China.Ann Epidemiol. 2013 Jun;23(6):301-6. doi: 10.1016/j.annepidem.2013.04.005. Ann Epidemiol. 2013. PMID: 23683708
-
Avian influenza virus H5N1: a review of its history and information regarding its potential to cause the next pandemic.Semin Pediatr Infect Dis. 2005 Oct;16(4):326-35. doi: 10.1053/j.spid.2005.07.002. Semin Pediatr Infect Dis. 2005. PMID: 16210112 Review.
-
[Influenza, an existing public health problem].Salud Publica Mex. 2006 May-Jun;48(3):244-67. doi: 10.1590/s0036-36342006000300009. Salud Publica Mex. 2006. PMID: 16813133 Review. Spanish.
Cited by
-
Modeling the first wave of Covid-19 pandemic in the Republic of Cyprus.Sci Rep. 2021 Apr 1;11(1):7342. doi: 10.1038/s41598-021-86606-3. Sci Rep. 2021. PMID: 33795723 Free PMC article.
-
Mask Wearing and Control of SARS-CoV-2 Transmission in the United States.medRxiv [Preprint]. 2020 Sep 1:2020.08.23.20078964. doi: 10.1101/2020.08.23.20078964. medRxiv. 2020. Update in: Lancet Digit Health. 2021 Mar;3(3):e148-e157. doi: 10.1016/S2589-7500(20)30293-4. PMID: 32869039 Free PMC article. Updated. Preprint.
-
The R0 package: a toolbox to estimate reproduction numbers for epidemic outbreaks.BMC Med Inform Decis Mak. 2012 Dec 18;12:147. doi: 10.1186/1472-6947-12-147. BMC Med Inform Decis Mak. 2012. PMID: 23249562 Free PMC article.
-
Measuring the impact of COVID-19 confinement measures on human mobility using mobile positioning data. A European regional analysis.Saf Sci. 2020 Dec;132:104925. doi: 10.1016/j.ssci.2020.104925. Epub 2020 Sep 12. Saf Sci. 2020. PMID: 32952303 Free PMC article.
-
A new estimation method for COVID-19 time-varying reproduction number using active cases.Sci Rep. 2022 Apr 23;12(1):6675. doi: 10.1038/s41598-022-10723-w. Sci Rep. 2022. PMID: 35461352 Free PMC article.
References
-
- Liu J, Xiao H, Lei F, Zhu Q, Qin K, et al. Highly pathogenic H5N1 influenza virus infection in migratory birds. Science. 2005;309:1206. - PubMed
-
- Chen H, Smith GJ, Zhang SY, Qin K, Wang J, et al. Avian flu: H5N1 virus outbreak in migratory waterfowl. Nature. 2005;436:191–192. - PubMed
-
- Osterholm MT. Preparing for the next pandemic. New England Journal of Medicine. 2005;352:1839–1842. - PubMed
-
- Webby RJ, Webster RG. Are we ready for pandemic influenza? Science. 2003;302:1519–1522. - PubMed
Publication types
MeSH terms
LinkOut - more resources
Full Text Sources
Miscellaneous
