. 2008 May 14;3(5):e2173.
doi: 10.1371/journal.pone.0002173.

Visual coding in locust photoreceptors

Affiliations

Visual coding in locust photoreceptors

Olivier Faivre et al. PLoS One. .

Abstract

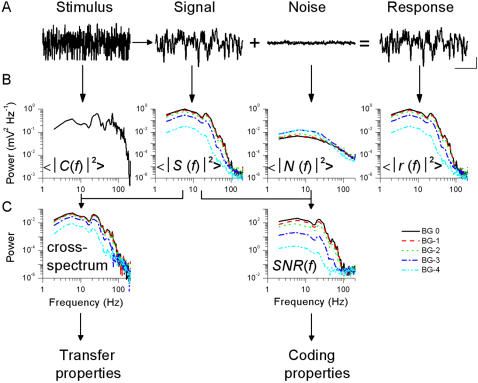
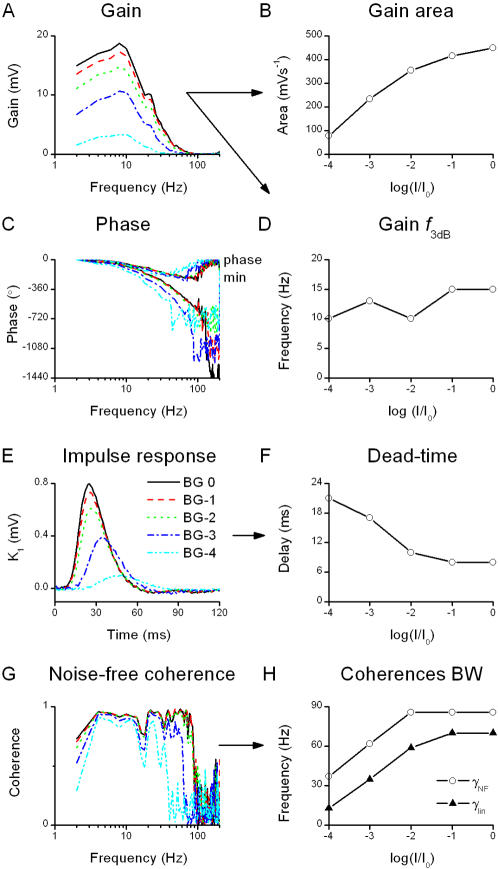
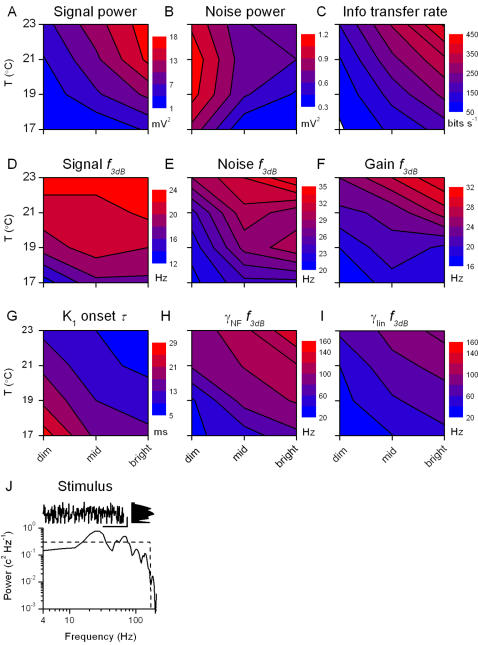
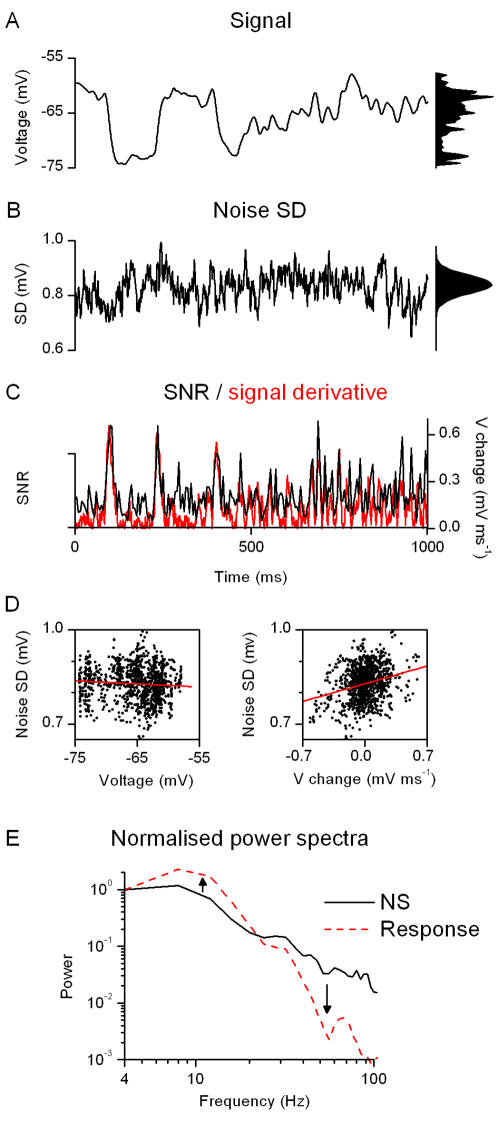
Information capture by photoreceptors ultimately limits the quality of visual processing in the brain. Using conventional sharp microelectrodes, we studied how locust photoreceptors encode random (white-noise, WN) and naturalistic (1/f stimuli, NS) light patterns in vivo and how this coding changes with mean illumination and ambient temperature. We also examined the role of their plasma membrane in shaping voltage responses. We found that brightening or warming increase and accelerate voltage responses, but reduce noise, enabling photoreceptors to encode more information. For WN stimuli, this was accompanied by broadening of the linear frequency range. On the contrary, with NS the signaling took place within a constant bandwidth, possibly revealing a 'preference' for inputs with 1/f statistics. The faster signaling was caused by acceleration of the elementary phototransduction current--leading to bumps--and their distribution. The membrane linearly translated phototransduction currents into voltage responses without limiting the throughput of these messages. As the bumps reflected fast changes in membrane resistance, the data suggest that their shape is predominantly driven by fast changes in the light-gated conductance. On the other hand, the slower bump latency distribution is likely to represent slower enzymatic intracellular reactions. Furthermore, the Q(10)s of bump duration and latency distribution depended on light intensity. Altogether, this study suggests that biochemical constraints imposed upon signaling change continuously as locust photoreceptors adapt to environmental light and temperature conditions.


Conflict of interest statement

Competing Interests: The authors have declared that no competing interests exist.

Figures

Figure 1
Figure 1. Signal and noise analysis of the voltage responses to a white-noise (WN) light stimulus.
A, A pseudorandom light intensity pattern superimposed on a constant light background provided a WN contrast stimulus that was presented 30 times to the cell. The evoked responses are averaged to give the voltage signal and the remaining differences are the noise traces (A, scale bars: 500 ms, 5 mV). B, The corresponding power spectra are calculated for each of the five light BGs. Note that 〈|S(f)|2〉, 〈|N(f)|2〉, and 〈|r(f)|2〉 are displayed using the same scale, in mV2 Hz−1. 〈|C(f)|2〉 is in c2 Hz−1. C, These changes can be further quantified by computing the signal-to-noise ratio spectrum, SNR(f), and the cross-spectrum between the signal and the stimulus. These two spectra are the starting points to quantify the properties of the photoreceptor voltage responses (Figs. 2 and 3), the SNR(f) being used for the analysis of the coding properties (Fig. 2) and the cross-spectrum for the analysis of the transfer properties (Fig. 3). ‘Power’ on the ordinate scale of the cross-spectrum means here c mV Hz−1.
Figure 2
Figure 2. Voltage responses to a WN light stimulus: analysis of the coding properties of the photoreceptor.
Analysis of the coding properties of the photoreceptor, based on the SNR(f) (Fig. 1C, right). A, The total signal power increases ∼40 times from BG-4 to BG0. The variance calculated in the time domain, σS 2, (not shown) is virtually identical, verifying the calculations. B, The total noise power is reduced ∼2 times from BG-4 to BG0. Here again it is identical to the noise variance calculated in the time domain, σN 2, (not shown). C, Information in the frequency domain is calculated from SNR(f) at each frequency as log2[SNR(f)+1]. All the information resides in a frequency range below 100 Hz. This information is integrated to give the information transfer rate (Shannon's formula), D, which increases ∼11 times from BG-4 to BG0. The ratio of the signal and noise variances, SNRt (not shown) scales well with the information transfer rate. This highlights that the information transfer rate is a measure of the number of the ‘coding states’ used by the cell during a second. These states are the different voltage levels confined within the used voltage range (which is ∼ signal as σS 2>>σN 2) and separated one from another by the ‘resolution’ of the system (noise). From information transfer rate estimates we define three relevant backgrounds: BG-3, named as ‘dim’ (∼100 bits/s); BG-2 as ‘mid’ (∼200 bits/s) and BG0 as ‘bright’ (∼300 bit.s−1). E, Linear coherence, γlin, is calculated from SNR(f). At dim BGs the stimulus is itself noisy (attributable to the photon shot-noise), and so is the cell's behavior. At bright BGs the cell's response (assuming linearity, see Materials and Methods) is remarkably noise-free (γlin>99% at BG0) up to ∼30 Hz.
Figure 3
Figure 3. Voltage responses to a WN light stimulus: analysis of the transfer properties of the photoreceptor.
Analysis of the transfer properties of the photoreceptor, based on the cross-spectrum between the stimulus and the signal (Fig. 1C, left). A, Gain is the norm of the frequency response (see Materials and Methods). It displays the range and extent of stimulus frequencies the cell amplify linearly. B, Areas (integrals) under gain curves at different BGs, and D, corresponding 3 dB cut-off frequencies. The amplification increases with the light BGs whereas the cut-off frequency remains virtually unchanged. C, Phase of the frequency response and the minimum phase, calculated from the gain curves, exhibits a phase-lag. E, Impulse response K1 is calculated from the frequency response function (real parts seen as gain, A, and phase, C). It approximates the linear filtering properties of the system. Brightening increases its area, scaling closely with the gain power (not shown), and reduces its onset-delay, F, as well as its time-to-peak (the delay between onset and peak is virtually constant ∼20 ms). The dead-times estimated from the phase-shift observed in C (not shown) and from the impulse response (F) behave very similarly, vindicating the analysis. G, Noise-free coherence, γNF, indicates the frequency range where a photoreceptor, if operating linearly, would reproduce exactly the same response at each stimulus presentation. γNF departs from unity at certain frequencies, reflecting selective nonlinearities, which enhance particular features of the stimulus. The bandwidths of the coherences, H, are defined as the frequency beyond which γ<0.5. The bandwidths increase with brightening BGs, reflecting the photoreceptor's ability to follow the stimulus on a shorter time-scale (γlin). This increased precision takes place in a frequency range where the photoreceptor encodes linearly the WN stimulus (γNFlin at each BG).
Figure 4
Figure 4. Light background and temperature are critical parameters for the visual coding in locust photoreceptors.
A, Light-induced depolarization, at 19°C, is clearly seen in 1 s-long recordings of the membrane potential of a photoreceptor adapted to different light conditions – to darkness and to three different light BGs. Brightening reduces voltage noise, as seen from the corresponding probability distributions (right; scale bar: 500 ms). B, Voltage responses of a dark-adapted photoreceptor to a 10 ms-long light pulse of saturating intensity at 17, 19, 21, and 23°C (scale bars: 100 ms, 10 mV) show that warming accelerates voltage responses to light but has little impact on their amplitude (∼40 mV). The mean potentials have been set to the same value for clarity. The arrow indicates a fast depolarizing transient , similar to the ones reported in Calliphora and Drosophila photoreceptors.
Figure 5
Figure 5. Analysis of the voltage responses to a light WN stimulus at different BGs and temperatures.
Changes in signal, A, and noise, B, power with brightening and warming lead to an increase in information transfer rate, C. Warming increases 3 dB cut-off frequencies of the signal, D, noise, E, and gain function, F. Dead-time in the voltage response, as seen with the onset time of the impulse response, G, is also reduced with both warming and brightening. H, Cut-off frequency of the noise-free coherence, γNF, i.e. the frequency beyond which γNF<0.5, and I, cut-off frequency of the linear coherence, γlin, are presented using the same scale, highlighting that for every experimental condition γNFlin. J, WN stimulus can be characterized by its temporal pattern (scale bars: 300 ms, 1 contrast unit), by its probability distribution and by its power spectrum.
Figure 6
Figure 6. Bump noise analysis of the voltage responses to a WN light stimulus.
A, Single photon response recorded in a dark-adapted photoreceptor at 26°C and super-imposed Γ-distribution (n = 4, τ = 8 ms). An initial estimate of these parameters is necessary to guide the fitting algorithm. These first-guess parameters can be estimated by calculating the power spectrum of a single bump and fitting a Lorentzian to obtained curve (see Materials and Methods). For this bump the parameters estimated in the frequency space gave n = 4, τ = 9 ms. The Γ-distribution accurately describes the bump shape. The mean residual of the fit is 0.085 mV2 (estimated between 0 and 90 ms, i.e. where the bump is actually happening), smaller than the fluctuations of membrane potential in bump-free zone (variance ∼0.1 mV2). B, At a given temperature we estimate the noise spectra of the voltage responses at the three adapting BGs and in darkness. The dark noise is virtually the same over the temperature range; it is subtracted from the total noise at each BG to give the light-induced noise power spectra. By fitting a single Lorentzian to these spectra we obtain parameters for the bump waveform (see Materials and Methods). C, Normalized bump shapes for different BGs at 19°C and for different temperatures at the dim BG illustrate that both brightening and warming accelerate the bumps. D, This is further quantified by estimating the bump durations (or time-to-peak; not shown as it displays identical behavior).
Figure 7
Figure 7. Bump latency distributions.
A, Latency distribution is calculated by deconvolving the bump shape from the corresponding impulse response (see Materials and Methods) at each experimental condition. B, Estimated latency distributions are shown for the same conditions as in Figure 6. As their time-to-peak decreases with brightening or warming, bumps appear sooner. C, The bumps are also more precise (synchronized), as it can be seen in the decrease of the width of the (normalized) latency distributions.
Figure 8
Figure 8. Voltage responses to a NS light pattern at 19°C.
A, In separate experiments, a NS light pattern is repeatedly presented to a photoreceptor as dim and bright intensity variations. B, The superimposed traces show the corresponding voltage responses to the 20th stimulus presentations. For the bright NS the cell dedicates a larger voltage range for encoding the stimulus. C, Averaging over the 100 individual traces gives the corresponding signals, normalized to exhibit the differences in their timing. With the dim NS the voltage output of the photoreceptor follows the light input with a delay greater than the one with the bright NS by ∼1 ms. Nevertheless, the voltage responses can follow the same stimulus pattern, suggesting that the photoreceptor is utilizing the same frequency range at different BGs. This is confirmed by the analysis of the responses power spectra at different points during the repeated stimulation (3rd and 30th traces), D. Whilst the amplification is higher for bright NS, as was already apparent in A, the range of frequencies encoded is virtually the same. This is quantified by calculating the 3 dB cut-off frequency, f 3 dB, which equals to 14 Hz in all cases. Comparing the spectra of the responses to the 3rd (left) and 30th (right) stimulation shows no additional adaptive trend, suggesting that the system adapts rapidly (after the 1st stimulation) to a relatively invariable coding state (see Text S1 and Fig. S2). The signal power spectra (not shown) look very similar to the power spectra of the responses, as expected from the high signal-to-noise ratio (Fig. 9).
Figure 9
Figure 9. Analysis of the voltage responses to a light NS stimulus at different BGs and temperatures.
Responses to a NS light stimulus change with warming and brightening. Behaviors of signal power, A, noise power, B and information transfer rate, C, as estimated with the triple extrapolation method, resemble those of the WN experiment (Fig. 5). D, signal 3 dB cut-off frequency remains virtually unchanged over all the BG-temperature conditions, differing dramatically from the WN experiment, whereas, the cut-off frequencies of noise power, E, and gain, F, behave much as in WN stimulation. Onset time of the impulse response, G, and the cut-off frequencies of the linear, H, and noise-free, I, coherences show similar evolution as seen with WN stimulation. The temporal pattern of the NS stimulus, J, displays long-term correlations (with no characteristic time constant), leading to a typical 1/f power spectrum trend and a probability distribution that completely departs from Gaussian (scale bars: 300 ms, 3 a.u. of light intensity).
Figure 10
Figure 10. Membrane properties deduced from the current steps experiment.
Voltage responses to the injected current steps were used to investigate the transmission properties of the photoreceptor membrane (Fig. S1). A, Membrane time-constant, τ, is greatly reduced from the dark-adapted state by dim light adaptation, but it reduces only slightly further with brightening BGs; i.e. the membrane ‘switches’ from a dark to a light-adapted state. B, Membrane resistance, R, displays a complex behavior in the light BG–temperature plane that correlates with the duration of the bumps, estimated from the noise power spectra (Fig. 6D). C, Mean membrane potential MMP shows that the light-induced depolarization increases by ∼15 mV from dark to bright BG, yet it is virtually temperature insensitive.
Figure 11
Figure 11. Dynamical properties of photoreceptor membrane investigated by WN currents.
A, Noise-free coherence, γNF, shows that the membrane can linearly translate WN current input into voltage output up to very high frequencies (500 Hz). B, Linear coherence, γlin, shows only very small noise contamination over the whole frequency range. C, Impedance curves, Z(f), show that photoreceptor membrane acts as a low-pass filter. Data for A–C was recorded at 19°C in dark and at the three light BGs; the results at the other temperatures show nearly identical behavior. From the impedance functions we estimated the resistance, R, and the 3 dB cut-off frequency, f 3dB. D, resistance estimate from WN stimulation strongly resembles the resistance estimated from the current steps experiment. E, Cut-off frequency is virtually constant and much higher than the cut-off frequency of the voltage responses to light. F, Plotting the normalized impedance (i.e. current-to-voltage gain) and the light-to-voltage gain clearly shows that, at the level of the photoreceptor soma, the membrane is not matched to filter out high-frequency phototransduction noise (shown for 19°C – mid BG, all conditions giving similar results).
Figure 12
Figure 12. The photoreceptors enhance transient features of the stimulus and flatten the probability density of the transmitted frequencies.
The reliability of temporal patterns in the photoreceptor responses is analyzed by comparing the average response, A (i.e. signal), to the time-dependent variability of the voltage responses, B (i.e. noise SD), evoked by a NS sequence. The probability distributions of these functions are shown in right. Noise SD is non-uniform across the stimulation pattern, calculated for every time-point across the voltage traces to the last 90 presentations of the NS light pattern (the first 10 showing an adapting trend), at the bright BG at 19°C. At every time-point (left) the spread of voltage values of the responses follows an individual distribution, varying from skewed to Gaussian; however, their overall probability distribution approximates a Gaussian (right). The changes in noise SD are then compared to the SNR, C, estimated by calculating the signal SD and the noise SD over 5 consecutive time points (using a 10-point window gives similar results). Notice that the amplitude of the rate of change in the signal, i.e. the absolute value of its time derivative (red trace), behaves similarly as the SNR, indicating that the locust photoreceptors encode most efficiently fast voltage changes. D, By ignoring their temporal order, 1000 values for (noise SD and signal) and (noise SD and rate of change of signal) are displayed as functions of voltage and rate of voltage change, respectively. The noise SD depends mostly on the rate of voltage change (linear fit slope = 0.08 ms, R = 0.26) and little on the instantaneous voltage value (linear fit slope = 0, R = −0.08). Notice that the noise SD does not only depend on the absolute value but also on the sign of the derivative. This could imply that there is an asymmetrical step in the phototransduction cascade, possibly arising from a process that involves 2 different time-constant for the transition between 2 different states (e.g. phosphorylated/non-phosphorylated). Such asymmetry would naturally occur if the 2 transitions involved 2 different enzymes. Alternatively, fast membrane dynamics or synaptic feedbacks could enhance depolarizing and hyperpolarizing response patterns asymmetrically. E, The normalized power spectra of the NS stimulus (ordinate units c2 Hz−1) and of one stretch of the photoreceptor response (as in Fig. 8, at bright BG, ordinate units mV2 Hz−1) illustrates how the cell enhances selected stimulus frequencies, whitening its output and increasing the entropy of transmitted signals.

Similar articles

Cited by

References

    1. Shapley RJ, Enroth-Cugell C. Visual adaptation and retinal gain controls. Prog Retinal Res. 1984;2:263–346.
    1. Barlow HB. The coding of sensory messages. Current Problems in Animal Behaviour. Cambridge: Cambridge University Press; 1961. pp. 331–360.
    1. Atick JJ. Could information theory provide an ecological theory of sensory processing? Network. 1992:213–251. - PubMed
    1. Järvilehto M, Zettler F. Electrophysiological-histological studies on some functional properties of visual cells and second order neurons of an insect retina. Z Zellforsch Mikrosk Anat. 1973;136:291–306. - PubMed
    1. Juusola M, Uusitalo RO, Weckström M. Transfer of graded potentials at the photoreceptor-interneuron synapse. J Gen Physiol. 1995;105:117–148. - PMC - PubMed

Publication types