. 2008 Jun;275(12):3072-87.
doi: 10.1111/j.1742-4658.2008.06461.x. Epub 2008 May 10.

A fluorescence energy transfer-based mechanical stress sensor for specific proteins in situ

Affiliations

A fluorescence energy transfer-based mechanical stress sensor for specific proteins in situ

Fanjie Meng et al. FEBS J. 2008 Jun.

Abstract

To measure mechanical stress in real time, we designed a fluorescence resonance energy transfer (FRET) cassette, denoted stFRET, which could be inserted into structural protein hosts. The probe was composed of a green fluorescence protein pair, Cerulean and Venus, linked with a stable alpha-helix. We measured the FRET efficiency of the free cassette protein as a function of the length of the linker, the angles of the fluorophores, temperature and urea denaturation, and protease treatment. The linking helix was stable to 80 degrees C, unfolded in 8 m urea, and rapidly digested by proteases, but in all cases the fluorophores were unaffected. We modified the alpha-helix linker by adding and subtracting residues to vary the angles and distance between the donor and acceptor, and assuming that the cassette was a rigid body, we calculated its geometry. We tested the strain sensitivity of stFRET by linking both ends to a rubber sheet subjected to equibiaxial stretch. FRET decreased proportionally to the substrate strain. The naked cassette expressed well in human embryonic kidney-293 cells and, surprisingly, was concentrated in the nucleus. However, when the cassette was located into host proteins such alpha-actinin, nonerythrocyte spectrin and filamin A, the labeled hosts expressed well and distributed normally in cell lines such as 3T3, where they were stressed at the leading edge of migrating cells and relaxed at the trailing edge. When collagen-19 was labeled near its middle with stFRET, it expressed well in Caenorhabditis elegans, distributing similarly to hosts labeled with a terminal green fluorescent protein, and the worms behaved normally.


Figures

Figure 1
Figure 1
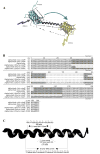
Geometry of stFRET. D and A are donor and acceptor dipole vectors, r is the length of linker. The three angles ( θA, θD, Φ) are the unknown parameters. RA–D is the distance between acceptor and donor chromophores.
Figure 2
Figure 2
Construction of stFRET protein and five variants. A. Schematic structure of stFRET. Cyan is the donor, Cerulean; yellow is the acceptor, Venus. The height of the β-can structure is 4.2nm. The black helix is the linker and it nominal length is 5.0nm. Incoming arrows indicate the excitation and outgoing ones the emission with wavelength marked adjacent and the width of the arrows is proportional to the light intensity. B. Alignment of the primary and modified linker DNA sequences. C. Modifications to the linker with DNA and amino acid sequences.
Figure 3
Figure 3
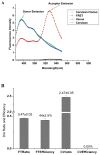
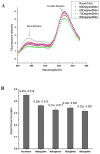
FRET efficiency and D/A ratio (mean ± SD). A. Spectra of stFRET, Cerulean and Venus monomers and Cerulean and Venus in 1:1 mixture. B. FRET efficiency and D/A Ratio of stFRET with Cerulean and Venus in 1:1 mixture. Data were taken with protein from three separate purifications. CV is Cerulean and Venus in a 1:1 mixture. Excitation 433nm, emission 460nm–550nm.
Figure 4
Figure 4
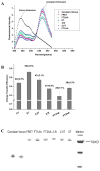
Modification of the linker changes FRET efficiency of six constructs. A. fluorescence spectra of stFRET and its five variants (scan parameters as Figure 3). B. FRET efficiency of the six constructs. C. SDS-PAGE gel of purified the proteins, and Cerulean and Venus monomers. FT stands for stFRET; 5T and 2.5T are constructs with 5 or 2.5 turns deletion from the linker; 2.5I is the construct with a 2.5 turn insert; FT1AA, FT2AA are the constructs with one amino acid or two amino acid deletions. All values are means ± SD and the data were taken with proteins from three separate purifications.
Figure 5
Figure 5
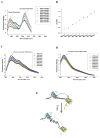
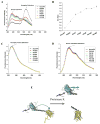
Melting the linker. A. Spectra from stFRET treated with 1 to 8M urea (scan parameters as Fig. 3B). B. D/ARatio of stFRET after different concentration urea treatments (means ± SD, n = 3 in each treatment), increasing D/A ratio indicates the recovery of donor emission and decrease of energy transfer. C. Cerulean monomer fluorescence with urea treatments (scan parameters as per Fig 3). D. Venus monomer fluorescence with urea (excitation at 515nm and scan 520–600nm). E. Urea melts the linker and leaves the donor and acceptor intact decreasing FRET energy transfer as donor emission recovering and D/ARatio increasing (definitions as per Figure 2 A).
Figure 6
Figure 6
Alpha-helix linker in stFRET is resistant to temperature melting. A. stFRET spectra under 60C° 2min, 60C° 5min, 70C° 5min and 80C° 5min temperature treatments (scan parameters as per Fig 3). B. stFRET D/A emission ratio after different temperature treatments (means ± SD, n = 3 in each treatment). Deg means degrees Celsius and roomtem means room temperature.
Figure 7
Figure 7
Two Units Proteinase K (1 Unit/μl) digests the linker but not Cerulean or Venus. Spectra of stFRET protein (A), Cerulean (C), and Venus (D) digested for 20 seconds, 1, 2, 3, 5, 10, 15 and 30 minutes at room temperature with 200μl 100μM protein. B. Time course of D/ARatio for proteinase K digestion of stFRET. E. Proteinase K cleaved the linker and eliminated FRET in stFRET protein (PK refers to proteinase K, S, seconds and M, minute. n = 3).
Figure 8
Figure 8
Double Streptag II tagged stFRET shows a decrease in FRET ratio when stretched on silicone rubber disks. Single and double Streptag II tagged stFRET were allowed to bind to either untreated or Streptactin modified silicone disks. FRET ratio was monitored in 10 spots on each disk during application of the suction stimulus shown. Only the disks with Streptactin treated surfaces and stFRET proteins having Streptag tags at both the C- and N- termini showed a significant change in FRET ratio when stretched.
Figure 9
Figure 9
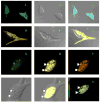
stFRET expressed in HEK-293 cells exhibits efficient FRET. Confocal reference image of Cerulean taken from the CFP channel (A) and the DIC channel (B) with the overlap in (C). Reference image of Venus from the YFP (D) and DIC channels (E) and the overlap in (F). Images of stFRET using the CFP channel (G), YFP channel (H), FRET channel (I) and the DIC channel (J) with the overlap of these four channels in image (K). FRET index was calibrated pixel by pixel using Xia’s method (L) [44]. Hollow black regions were excluded from the calculation because of intensity saturation. stFRET is localized in the nucleus and especially concentrated in the nucleoli (arrow heads).
Figure 10
Figure 10
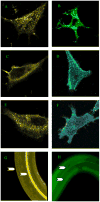
Normal expression of stFRET in various host proteins. Alpha-actinin-stFRET (A), alpha-actinin-GFP (B), filamin A-stFRET (C), filamin A-CFP (D), spectrin-stFRET (E) and spectrin-CFP (F) in 3T3 fibroblast cells; Collagen-19-stFRET (G) and collagen-19-GFP (H) in C. elegans (with assistance of Dr. R. Gronostajski ); Arrow heads indicate the striated expression pattern and central line in the worm cuticle.
Figure 11
Figure 11
stFRET senses the strain change in actinin and filamin. Actinin-stFRET transfected 3T3 fibroblast confocal images were taken in three channels: CFP donor channel (A), FRET channel (B), YFP acceptor channel (C). Actinin-stFRET protein expression levels were displayed by applying image J lookup table (LUT) 16-color color map to the YFP acceptor channel image. Arrows show the leading edge, lagging edge and the cell domains with missing filopodia (D). FRET efficiency was calculated by E = nF/(nF + ID) in which nF is the net FRET from FRET channel and ID is donor intensity from donor channel. E value was showed by image J lookup table (LUT) 16-color color map (E). Three cell domains were selected for statistical analysis of E and fourteen confocal stacks of each domain were measured and analyzed (F). Histogram bars were assigned same colors as the related domains in (E). Filamin-stFRET confocal images (G, H, I, J, K and L). Three scan channels (G, H and I) are as actinin-stFRET images. Arrangements and statistics of filamin-stFRET images (J, K and L) are as in actinin-stFRET images.

References

    1. Ortiz V, Nielsen SO, Klein ML, Discher DE. Unfolding a linker between helical repeats. J Mol Biol. 2005;349:638–647. - PubMed
    1. Craig D, Gao M, Schulten K, Vogel V. Structural insights into how the MIDAS ion stabilizes integrin binding to an RGD peptide under force. Structure. 2004;12:2049–2058. - PubMed
    1. Kosztin I, Bruinsma R, O’Lague P, Schulten K. Mechanical force generation by G proteins. Proc Natl Acad Sci U S A. 2002;99:3575–3580. - PMC - PubMed
    1. Marszalek PE, Lu H, Li H, Carrion-Vazquez M, Oberhauser AF, Schulten K, Fernandez JM. Mechanical unfolding intermediates in titin modules. Nature. 1999;402:100–103. - PubMed
    1. Carter NJ, Cross RA. Kinesin’s moonwalk. Current Opinion In Cell Biology. 2006;18:61–67. - PubMed

Publication types

MeSH terms