. 2008 May 14;28(20):5394-400.
doi: 10.1523/JNEUROSCI.5706-07.2008.

The relationship between nature of social change, age, and position of new neurons and their survival in adult zebra finch brain

Affiliations

The relationship between nature of social change, age, and position of new neurons and their survival in adult zebra finch brain

Einat Adar et al. J Neurosci. .

Abstract

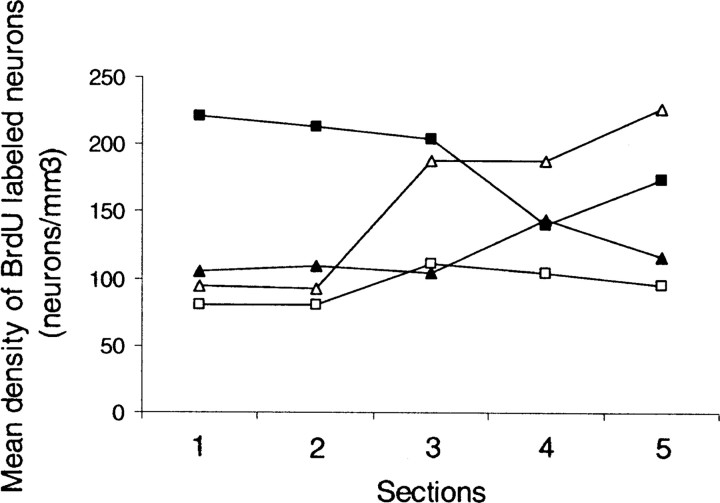
Some kinds of neurons are spontaneously recruited in the intact, healthy adult brain, but the variables that affect their survival are not always clear. We show that in caudal nidopallium of adult male zebra finches, the rostrocaudal position of newly recruited neurons, their age (1 vs 3 months), and the nature of social change (complex vs simple) after the neurons were born affect their survival. Greater social complexity promoted the survival of younger new neurons, and the demise of older ones; a less marked social change promoted the survival of older new neurons. These effects were position dependent. We suggest that functional correlations between new neuron recruitment/survival and its inferred benefit to the animal might be better perceived when taking into account the position of cells, their age at the time of life style changes, and the nature and magnitude of the life style change.


Figures

Figure 1.
Figure 1.
Three confocal images of the same brain section demonstrating double-labeling of Hu (brown) and BrdU (florescence red). Only one (red nucleus) of the several neurons (Hu+, brown) shown in this field was born at the time of BrdU injections. A, BrdU labeling. B, Hu labeling. C, BrdU and Hu labeling. Scale bar, 10 μm.
Figure 2.
Figure 2.
A, Top schematic view of the brain of an adult zebra finch male; caudal is to the left, rostral is to the right. We indicate the range within which frontal sections were taken from the NC, HVC, and HC. B–D, A few sections were sampled in each brain region along the rostrocaudal axis (for details, see Materials and Methods); however, here only three are shown: the most rostral, the middle, and the most caudal ones (from left to right) in NC (B), HC (C), and HVC (D). Cb, Cerebellum; LAD, lamina arcopallialis dorsalis; TeO, tectum opticum; V, lateral ventricle; LPO, lobus parolfactorius [now referred to as medial striatum; nomenclature is according to Reiner et al. (2004)].
Figure 3.
Figure 3.
Mean density (neurons per cubic millimeter ± SE) of BrdU+ neurons in NC, in five sections (from top to bottom in rostrocaudal order) in brains of males that were exposed to different social environments: C1M, S1M, C3M, S3M (for details, see Results). The sample size in each group was, respectively, 7, 6, 7, and 6.
Figure 4.
Figure 4.
Mean density (neurons per cubic millimeter ± SE) of BrdU+ neurons in the NC, in brains of males that were exposed to a complex or simple social environment. White bars, Groups that were exposed to the new social setting 1 month after BrdU treatment (C1M and S1M); black bars, groups that were exposed to the new social setting 3 months after BrdU treatment (C3M and S3M). This figure is derived from Figure 3 to show the interaction between social setting and neuronal age (for details, see Results). The sample size in each group was, respectively, 7, 6, 7, and 6.
Figure 5.
Figure 5.
Mean density (neurons per cubic millimeter) of BrdU+ neurons in five sections in the NC, in brains of males that were exposed to different social environments: ▵, C1M; □, S1M; ▴, C3M; ■, S3M. This figure is derived from Figure 3 to demonstrate the interaction between position along the NC rostrocaudal axis (section number) and social setting (for details, see Results). Lines are drawn for descriptive purposes only. The sample size in each group was, respectively, 7, 6, 7, and 6.

References

    1. Adar E, Lotem A, Barnea A. The effect of social environment on singing behavior in the zebra finch (Taeniopygia guttata) and its implication for neuronal recruitment. Behav Brain Res. 2008;187:178–184. - PubMed
    1. Altman J. Are new neurons formed in the brains of adult mammals? Science. 1962;135:1127–1128. - PubMed
    1. Altman J. Autoradiographic investigation of cell proliferation in the brains of rats and cats. Anat Rec. 1963;145:573–591. - PubMed
    1. Altman J. Postnatal growth and differentiation of the mammalian brain, with implications for a morphological theory of memory. In: Quarton GC, Melnechuk T, Schmitt FO, editors. The neurosciences. First study program. New York: Rockefeller UP; 1967. pp. 723–743.
    1. Altman J. DNA metabolism and cell proliferation. In: Lajtha A, editor. Structural neurochemistry, handbook of neurochemistry. Vol 2. New York: Plenum; 1969. pp. 137–182.

Publication types

MeSH terms