. 2008 Aug;19(8):1483-90.
doi: 10.1681/ASN.2007090971. Epub 2008 May 14.

Impaired immune responses and antigen-specific memory CD4+ T cells in hemodialysis patients

Affiliations

Impaired immune responses and antigen-specific memory CD4+ T cells in hemodialysis patients

Nicolle Helena Renier Litjens et al. J Am Soc Nephrol. 2008 Aug.

Abstract

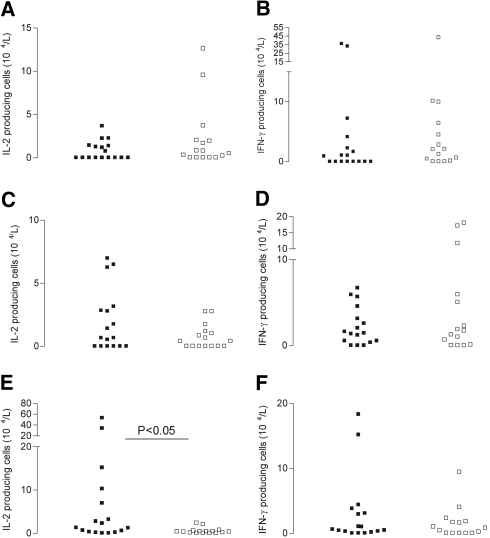
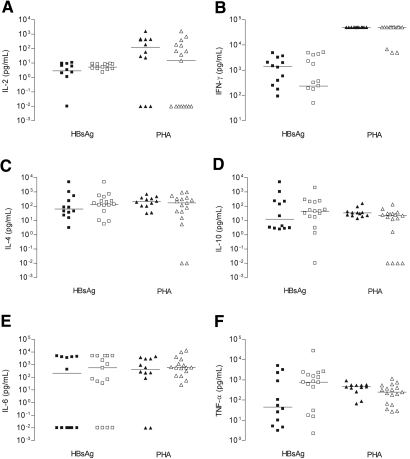
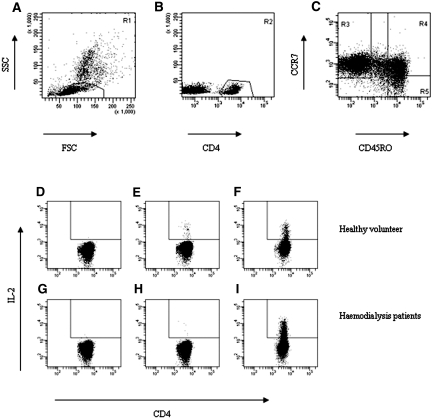
Serologic responses to T cell-dependent vaccinations are severely attenuated in patients with ESRD, but the reasons for this is unknown. In this study, a detailed analysis of antigen-specific T cell responses was performed. Patients on hemodialysis and age- and gender-matched healthy control subjects were vaccinated with hepatitis B surface antigen (HBsAg), antigen-specific CD4(+) T cells were monitored at regular intervals with intracellular cytokine staining and proliferation assays. IL-2-and IFN-gamma-producing CD4(+) T cells were identified as either central or effector memory CD4(+) T cells using antibodies directed against CD45RO and the chemokine receptor CCR7. Control subjects mounted a memory T cell response comprising both central and effector memory CD4(+) T cells, with the central memory response occurring 1 wk before the effector memory response. IL-2(+) HBsAg-specific memory CD4(+) T cells were primarily detected within the effector population. Patients with ESRD showed a delayed response of IL-2-and IFN-gamma-producing central memory CD4(+) T cells, but their maximal responses were similar to those of control subjects. In contrast, patients with ESRD produced only 6.3% of the IL-2(+) HBsAg-specific effector memory CD4(+) T cells produced by control subjects (0.5 +/- 0.2 x 10(4)/L versus 8 +/- 3.5 x 10(4)/L; P < 0.001), and this impaired response correlated with antigen-specific T cell proliferation and anti-HBsAg IgG titers. In conclusion, the production of antigen-specific effector memory CD4(+) T cells after vaccination, which is critical to achieve an adequate humoral response, is severely impaired in patients with ESRD.


Figures

Figure 1.
Figure 1.
Kinetics of HBsAg-specific IL-2–and IFN-γ–producing CD4+ T lymphocytes in the study population. PBMC were stimulated with αCD28 and αCD49d and HBsAg for 6 h in the presence of Brefeldin A for the last 5 h of incubation. Thereafter, the percentage of IL-2+ (A, C, E, and G) or IFN-γ+ (B, D, F, and H) cells was determined for the different T cell subsets. T cell subsets were defined by expression of cell surface markers CD4, CD45RO, and CCR7. The following subsets were defined Tnaive (CD4+CD45ROCCR7+), Tcm cells (CD4+CD45RO+CCR7+), and Tem cells (CD4+CD45RO+CCR7). ▪, Signals observed for healthy volunteers; □, signals observed for patients with ESRD. On the x axis, the various time intervals are depicted, and on the y axis, mean ± SEM percentages of HBsAg-specific cytokine-producing CD4+ (A and B), Tnaive (C and D), Tcm (E and F), and Tem (G and H) cells are displayed, respectively. *Significantly (P < 0.05) different from healthy volunteers.
Figure 2.
Figure 2.
Peak responses for HBsAg-specific IL-2–and IFN-γ–producing cells. Peak responses of absolute numbers of HBsAg-specific IL-2–and IFN-γ–producing naive (A and B), central memory (C and D), and effector memory (E and F) CD4+ T lymphocytes obtained within 4 wk after HBsAg vaccination. Absolute peak numbers of cells producing HBsAg-specific IL-2 and IFN-γ are displayed for healthy control subjects (▪) and patients with ESRD (□).
Figure 3.
Figure 3.
(A and B) PHA-induced IL-2–producing (A) and IFN-γ–producing (B) CD4+ T lymphocytes in study population. Similar as described in Figure 1, percentages of IL-2–producing (A) and IFN-γ–producing CD4+ T cells induced by PHA were determined. On the y axis, the percentages of cytokine producing cells (mean ± SEM) are displayed and on the x axis, the different CD4+ T cell subsets. ▪, signals observed for healthy volunteers; □, signals for patients with ESRD. *Significantly (P < 0.05) different from healthy volunteers.
Figure 4.
Figure 4.
Levels of HBsAg-specific cytokines produced after re-stimulation. PBMC, obtained 2 wk after receipt of the last HBV booster vaccination, were stimulated with HBsAg (5 μg/ml; squares) or polyclonal with PHA (1 μg/ml; triangles). At day 6, the cells were re-stimulated for 48 h using fresh PBMC (1 × 10⁵) with or without the various stimuli. The closed symbols represent healthy control subjects, and the open symbols represent the patients with ESRD.
Figure 5.
Figure 5.
Kinetics of HBsAg-specific proliferation. At the various intervals, freshly isolated PBMC were stimulated with medium alone and HBsAg (5 μg/ml) for 6 d. At day 6, proliferation was determined by 3H-thymidine incorporation and is expressed as counts per minute (cpm). Subsequently, stimulation indices (SI) were calculated by dividing the HBsAg-induced proliferation by that induced by culture medium alone. On the x axis, various time intervals after the last HBV vaccination are depicted and on the y axis, proliferation expressed as SI. ▪, Responses for healthy volunteers; □, responses for patients with ESRD. *Significantly (P < 0.05) different from healthy volunteers.
Figure 6.
Figure 6.
Anti-HBsAg titers. Four weeks after receipt of the last HBV vaccination, anti-HBsAg titers were measured. On the y axis, anti-HBs titers (IU/L) are depicted, and on the x axis, the healthy volunteers (▪) and patients with ESRD (□). The dotted lines represent the <10 IU/L (nonresponders) and >100 IU/L (good responders).
Figure 7.
Figure 7.
(A and B) Peak responses for both percentages (A) and absolute numbers (B) of HBsAg-specific IL-2 effector memory CD4+ T cells correlate with anti-HBsAg titers. Peak responses for HBsAg-specific percentages and absolute numbers of IL-2–producing effector memory CD4+ T cells are associated with anti-HBsAg titers measured 4 wk after the last HBV vaccination. On the x axis, anti-HBs titers (IU/L) are depicted, and on the y axis, percentages (A) and absolute numbers (B) of HBsAg-specific IL-2–producing effector memory CD4+ T cells are displayed. ▪, Responses for healthy volunteers; □, responses for patients with ESRD. Spearman rank correlation was calculated using SPSS for Windows.
Figure 8.
Figure 8.
Typical example of flowcytometric analysis of IL-2–producing Tem of healthy volunteer (D through F) and a hemodialysis patient (G through I) 2 wk after the last booster of HBV vaccination. A typical example of the flowcytometric analysis of cytokine-producing T cells. (A and B) The lymphocyte population (A) was gated first (R1), and subsequently the CD4+ T lymphocytes (R2) were gated within these lymphocytes (B). (C) Next, we identified the proportions of CD4+ T lymphocytes (R1+R2) in the various subsets using a dotplot of CCR7 versus CD45RO. Naive CD4+ T cells are displayed in region 3; central memory CD4+ T cells in region 4 and region 5 displays the effector memory CD4+ T population. (D through I) Next, the IL-2 signals observed for CD4+ Tem in presence of co-stimulation only (D and G), co-stimulation with HBsAg (E and H), and co-stimulation with PHA (F and I) are plotted for a healthy volunteer and a hemodialysis patient 2 wk after the last HBV vaccination. Percentages represent IL-2–producing cells.

References

    1. Kurz P, Kohler H, Meuer S, Hutteroth T, Meyer zum Buschenfelde KH: Impaired cellular immune responses in chronic renal failure: Evidence for a T cell defect. Kidney Int 29: 1209–1214, 1986 - PubMed
    1. Quadracci LJ, Ringden O, Krzymanski M: The effect of uremia and transplantation on lymphocyte subpopulations. Kidney Int 10: 179–184, 1976 - PubMed
    1. Raska K Jr, Raskova J, Shea SM, Frankel RM, Wood RH, Lifter J, Ghobrial I, Eisinger RP, Homer L: T cell subsets and cellular immunity in end-stage renal disease. Am J Med 75: 734–740, 1983 - PubMed
    1. Krishnamurthy G, Kher V, Naik S: Low response to HBsAg vaccine in chronic renal failure patients is not due to intrinsic defect of B cells. Scand J Urol Nephrol 36: 377–382, 2002 - PubMed
    1. Libetta C, Rampino T, Dal Canton A: Polarization of T-helper lymphocytes toward the Th2 phenotype in uremic patients. Am J Kidney Dis 38: 286–295, 2001 - PubMed

Publication types