. 2008 Jul;100(1):371-84.
doi: 10.1152/jn.00062.2008. Epub 2008 May 14.

Intrinsic and extrinsic light responses in melanopsin-expressing ganglion cells during mouse development

Affiliations

Intrinsic and extrinsic light responses in melanopsin-expressing ganglion cells during mouse development

Tiffany M Schmidt et al. J Neurophysiol. 2008 Jul.

Abstract

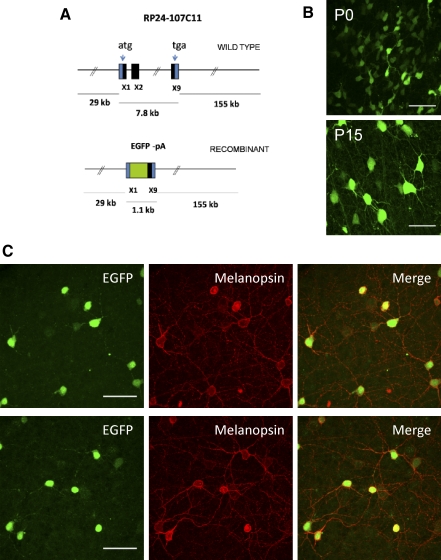
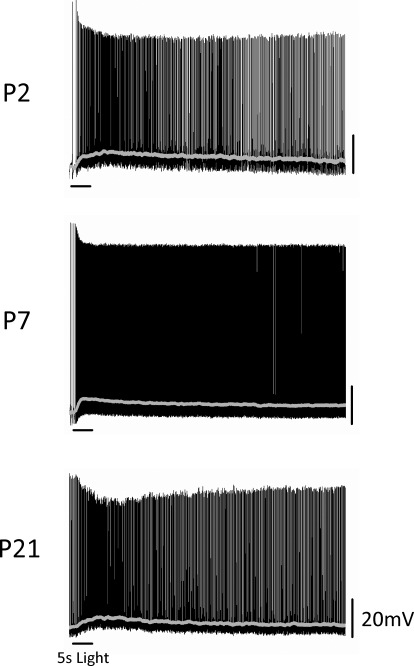
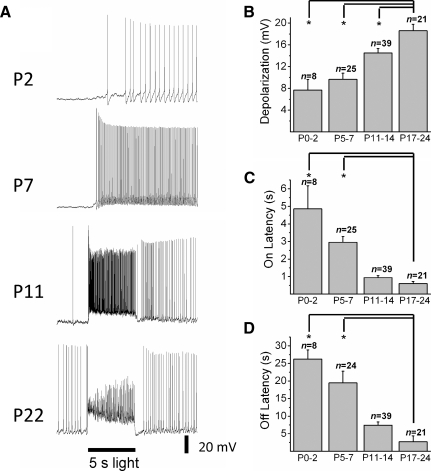
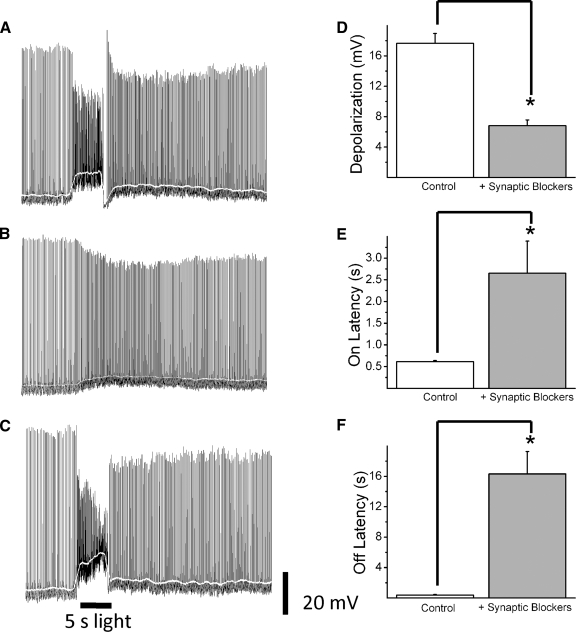
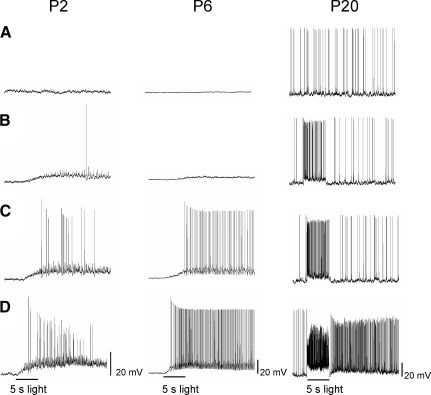
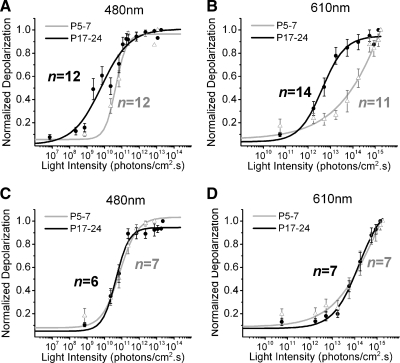
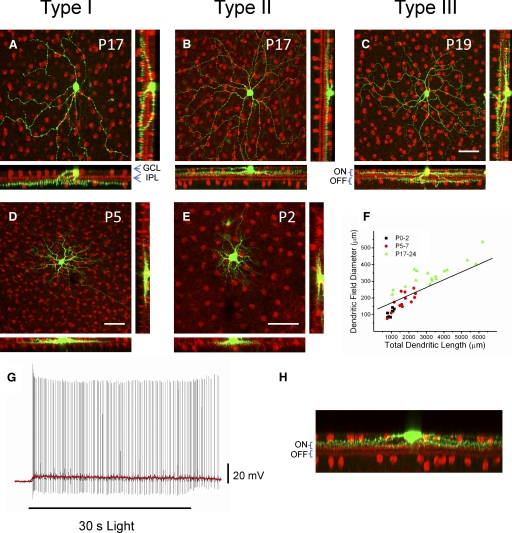
Melanopsin (Opn4) is a photopigment found in a subset of retinal ganglion cells (RGCs) that project to various brain areas. These neurons are intrinsically photosensitive (ipRGCs) and are implicated in nonimage-forming responses to environmental light such as the pupillary light reflex and circadian entrainment. Recent evidence indicates that ipRGCs respond to light at birth, but questions remain as to whether and when they undergo significant functional changes. We used bacterial artificial chromosome transgenesis to engineer a mouse line in which enhanced green fluorescent protein (EGFP) is expressed under the control of the melanopsin promoter. Double immunolabeling for EGFP and melanopsin demonstrates their colocalization in ganglion cells of mutant mouse retinas. Electrophysiological recordings of ipRGCs in neonatal mice (postnatal day 0 [P0] to P7) demonstrated that these cells responded to light with small and sluggish depolarization. However, starting at P11 we observed ipRGCs that responded to light with a larger and faster onset (<1 s) and offset (<1 s) depolarization. These faster, larger depolarizations were observed in most ipRGCs by early adult ages. However, on application of a cocktail of synaptic blockers, we found that all cells responded to light with slow onset (>2.5 s) and offset (>10 s) depolarization, revealing the intrinsic, melanopsin-mediated light responses. The extrinsic, cone/rod influence on ipRGCs correlates with their extensive dendritic stratification in the inner plexiform layer. Collectively, these results demonstrate that ipRGCs make use of melanopsin for phototransduction before eye opening and that these cells further integrate signals derived from the outer retina as the retina matures.


Figures

FIG. 1.
FIG. 1.
Generation and initial characterization of Opn4-enhanced green fluorescent protein (EGFP) mouse line. A: schematic representation of the transgene Opn4-EGFP. The 192-kb mouse genomic bacterial artificial chromosome (BAC) clone RP24-107C11 containing the entire transcriptional unit of Opn4 together with 29 kb of upstream and 155 kb of downstream sequence was engineered to harbor EGFP coding sequences followed by a polyadenylation (pA) signal in the coding region of the Opn4 gene by homologous recombination in Escherichia coli. X1, X2, and X9 represent exon 1, exon 2, and exon 9 with the start codon in exon 1 (ATG) and stop codon (TGA) in exon 9. B: confocal images of intrinsic EGFP signals in whole-mount retinas of Opn4-EGFP mouse at postnatal day 0 (P0, top) and P15 (bottom). C: immunostaining for EGFP (green) and melanopsin (red) of adult (P21) whole-mount EGFP-Opn4 retinas. Scale bar: 50 μm (B and C).
FIG. 2.
FIG. 2.
Intrinsic light responses of EGFP-positive ganglion cells in whole-mount Opn4-EGFP retinas. Membrane potential of EGFP-positive ganglion cells was recorded in current-clamp mode at ages P2, P7, and P21. A full-field white-light stimulus of 5-s duration was applied to the retina. A cocktail of pharmacological blockers was also included to prevent any rod- or cone-driven influences in the light responses. Gray line shows membrane potential values averaged over a 1-s sliding time window.
FIG. 3.
FIG. 3.
Light-evoked responses of intrinsically photosensitive retinal ganglion cells (ipRGCs) at various stages of mouse development. A: recordings of representative light responses at P2, P7, P11, and P22 in response to a 5-s full-field white-light stimulus in the absence of synaptic blockers. Amplitude (mean ± SE) of average depolarization (B) on latency (C) and off latency (D) are shown for the various stages of mouse development (on latency: P0–P2 = 4.9 ± 1.3 s; P5–P7 = 3.0 ± 0.3 s; P11–P14 = 0.9 ± 0.1 s; P17–P24 = 0.6 ± 0.1 s and off latency: P0–P2 = 26.2 ± 2.6 s; P5–P7 = 19.5 ± 3.4 s; P11–P14 = 7.4 ± 0.9 s; P17–P24 = 2.7 ± 1.7 s). Error bars represent SE. *P < 0.001.
FIG. 4.
FIG. 4.
Influence of glutamatergic synaptic inputs on ipRGC light-evoked responses. Representative traces of an ipRGC response to a 5-s full-field white-light stimulus from a P21 mouse recorded in the absence (A) or presence (B) of a cocktail of glutamatergic receptor blockers. Traces in C show the same cell on washout of the synaptic blockers. Amplitude (mean ± SE, n = 10) of depolarization (D) on latency (E) and off latency (F) are shown in the absence and presence of synaptic blockers. White line shows membrane potential values averaged over a 1-s sliding time window. Error bars represent SE. *P < 0.01.
FIG. 5.
FIG. 5.
Light-evoked responses of ipRGCs to increasing (top to bottom) intensities of 5-s full-field 480-nm light stimulation. Representative light responses at P2 (left column), P6 (middle column), and P20 (right column). Stimulus intensity (in photons·cm−2·s−1) for P2: 2.28 × 10⁹ (A), 2.28 × 10¹⁰ (B), 6.84 × 10¹⁰ (C), and 2.28 × 10¹¹ (D). Stimulus intensity (in photons·cm−2·s−1) for P6: 7.30 × 10⁸ (A), 2.28 × 10¹¹ (B), 6.84 × 10¹¹ (C), and 2.28 × 10¹² (D). Stimulus intensity (in photons·cm−2·s−1) for P20: 2.28 × 10⁸ (A), 2.28 × 10⁹ (B), 7.30 × 10⁹ (C), and 1.82 × 10¹² (D).
FIG. 6.
FIG. 6.
Differences in sensitivity of light-evoked responses in P17–P24 and P5–P7 retinas. AD: irradiance–response curves to 480- and 610-nm light in the absence (A and B) and presence (C and D) of glutamatergic synaptic blockers. Irradiance yielding half-maximal response (IR50) in photons·cm−2·s−1 IR50P17–P24 ≅ 5.6 × 10⁹, IR50P5–P7 ≅ 3.9 × 10¹⁰ (A); IR50P17–P24 ≅ 3.5 × 10¹², IR50P5–P7 ≅ 7.9 × 10¹³ (B); IR50P17–P24 ≅ 3.9 × 10¹⁰, IR50P5–P7 ≅ 6.3 × 10¹⁰ (C); IR50P17–P24 ≅ 7.9 × 10¹³, IR50P5–P7 ≅ 7.9 × 10¹³ (D).
FIG. 7.
FIG. 7.
Morphological diversity of ipRGCs during mouse development. Whole-mount retinas of ipRGCs filled with biocytin/neurobiotin (in green) and immunostained ChAT (in red) to visualize cholinergic amacrine cells (AE). Top row: examples of 3 types of ipRGCs in P17–P24 mice. ChAT-positive cell bodies are in the GCL and the INL, whereas their projections form 2 bands visible in the rotated images that run along the on and off sublamina of the IPL (bottom and right panels of AE). A: monostratified ipRGC (P17) with dendritic arborization in the off sublamina of the IPL (type I ipRGC). B: monostratified ipRGC (P17) with dendritic arborization in the on sublamina of the IPL (type II ipRGC). C: bistratified ipRGC (P19) with on and off segregated arborization with respect to the 2 anti-ChAT–labeled bands (type III ipRGC). D and E: examples of ipRGC confocal images taken from P5 and P2 mice. F: dendritic length and dendritic field diameter of individual ipRGCs at P0–P2, P5–P7, and P17–P24. G: example of intrinsic light response (p53) of type II cell to a 30-s white-light stimulus recorded in current-clamp mode in the presence of synaptic blockers. Red line shows membrane potential values averaged over a 1-s sliding time window. H: dendritic stratification of cell from G in the on sublamina of the IPL. ChAT, choline acetyl transferase; GCL, ganglion cell layer; IPL, inner plexiform layer. Scale bars: 50 μm for AE.

References

    1. Aggelopoulos NC, Meissl H. Responses of neurones of the rat suprachiasmatic nucleus to retinal illumination under photopic and scotopic conditions. J Physiol 523: 211–222, 2000. - PMC - PubMed
    1. Baver SB, Pickard GE, Sollars PJ, Pickard GE. Two types of melanopsin retinal ganglion cell differentially innervate the hypothalamic suprachiasmatic nucleus and the olivary pretectal nucleus. Eur J Neurosci 27: 1763–1770, 2008. - PubMed
    1. Belenky MA, Smeraski CA, Provencio I, Sollars PJ, Pickard GE. Melanopsin retinal ganglion cells receive bipolar and amacrine cell synapses. J Comp Neurol 460: 380–393, 2003. - PubMed
    1. Berson DM Strange vision: ganglion cells as circadian photoreceptors. Trends Neurosci 26: 314–320, 2003. - PubMed
    1. Berson DM Phototransduction in ganglion-cell photoreceptors. Pfluegers Arch 454: 849–855, 2007. - PubMed

Publication types

MeSH terms

LinkOut - more resources