. 2008 Jul;19(7):3147-62.
doi: 10.1091/mbc.e08-01-0035. Epub 2008 May 14.

Live cell dynamics of promyelocytic leukemia nuclear bodies upon entry into and exit from mitosis

Affiliations

Live cell dynamics of promyelocytic leukemia nuclear bodies upon entry into and exit from mitosis

Yi-Chun M Chen et al. Mol Biol Cell. 2008 Jul.

Abstract

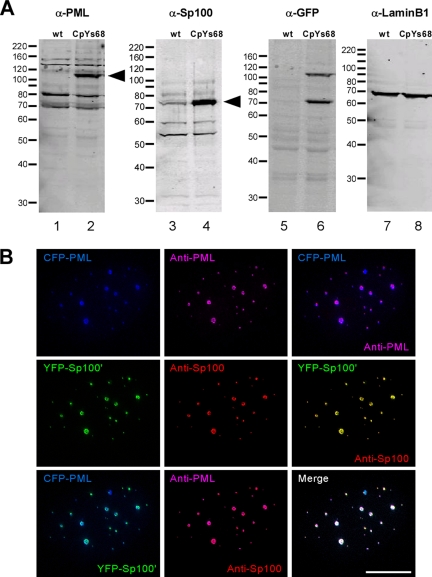
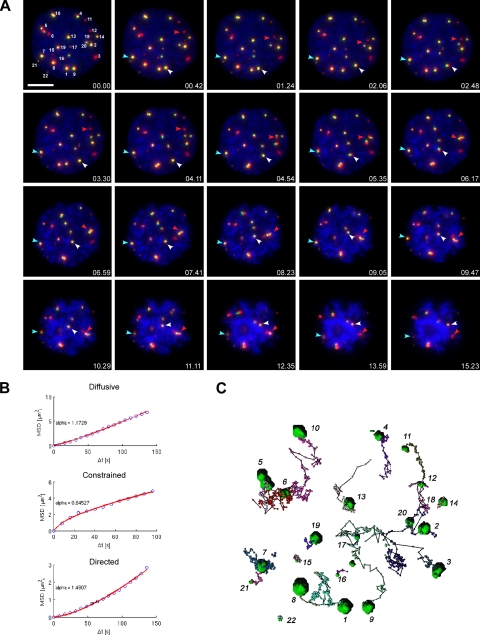
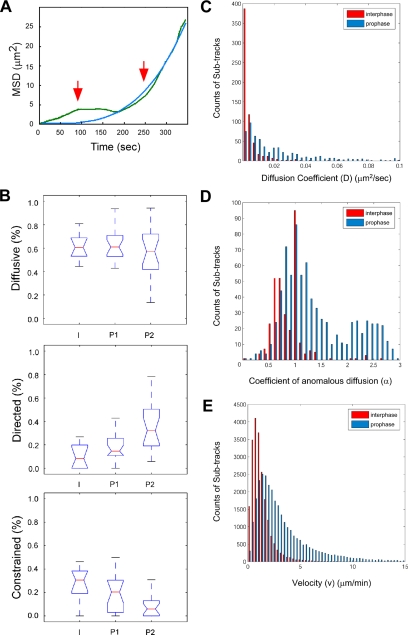
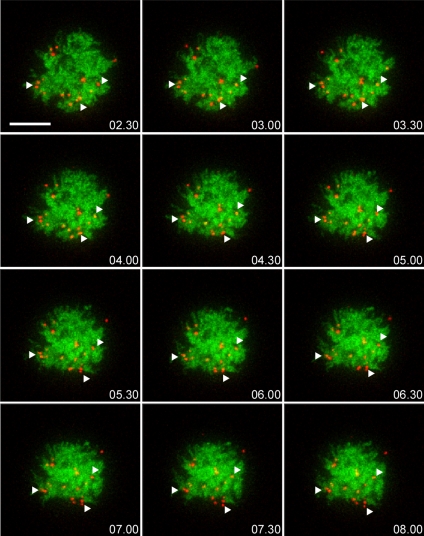
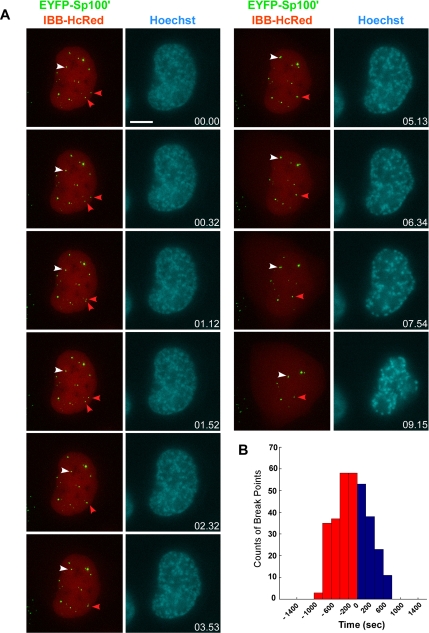
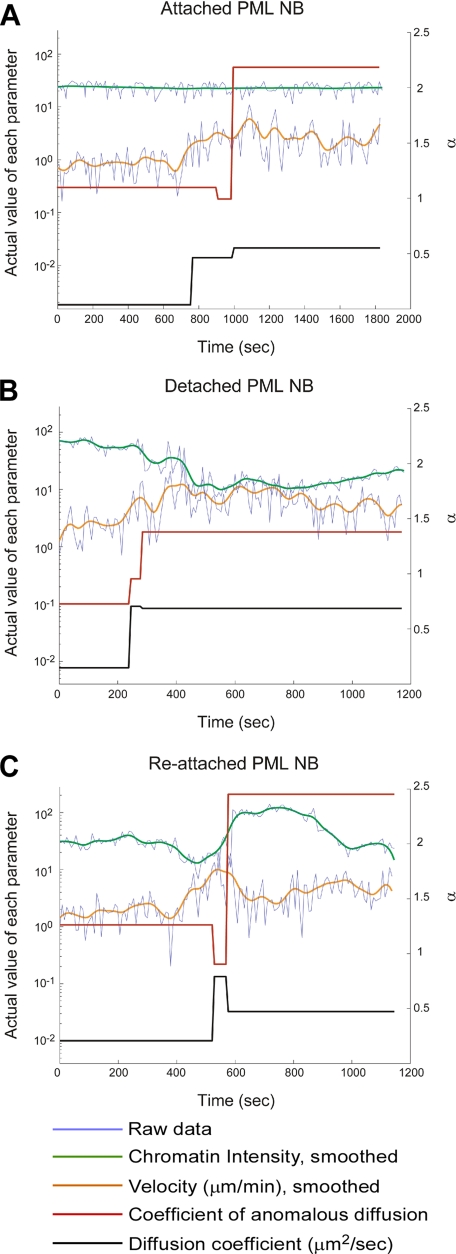
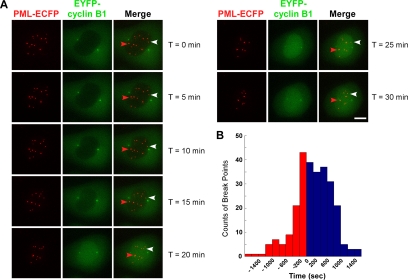
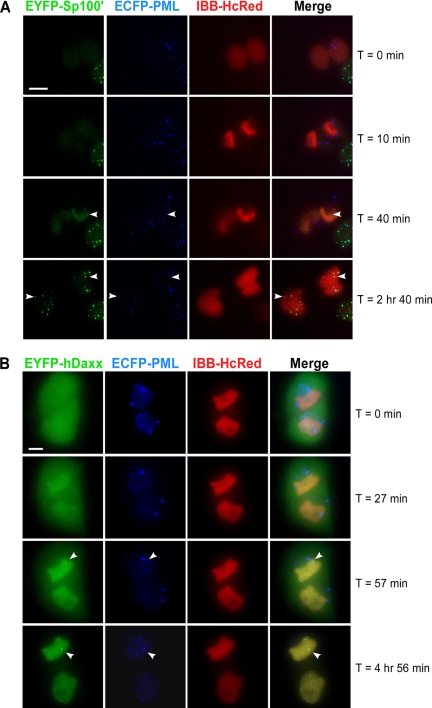
Promyelocytic leukemia nuclear bodies (PML NBs) have been proposed to be involved in tumor suppression, viral defense, DNA repair, and/or transcriptional regulation. To study the dynamics of PML NBs during mitosis, we developed several U2OS cell lines stably coexpressing PML-enhanced cyan fluorescent protein with other individual marker proteins. Using three-dimensional time-lapse live cell imaging and four-dimensional particle tracking, we quantitatively demonstrated that PML NBs exhibit a high percentage of directed movement when cells progressed from prophase to prometaphase. The timing of this increased dynamic movement occurred just before or upon nuclear entry of cyclin B1, but before nuclear envelope breakdown. Our data suggest that entry into prophase leads to a loss of tethering between regions of chromatin and PML NBs, resulting in their increased dynamics. On exit from mitosis, Sp100 and Fas death domain-associated protein (Daxx) entered the daughter nuclei after a functional nuclear membrane was reformed. However, the recruitment of these proteins to PML NBs was delayed and correlated with the timing of de novo PML NB formation. Together, these results provide insight into the dynamic changes associated with PML NBs during mitosis.


Figures

Figure 1.
Figure 1.
Characterization of double stable cell line. (A) U2OS cells were stably transfected with PML-ECFP and EYFP-Sp100′. Whole cell extracts from both parental U2OS cells (wt) and double stable cells (CpYs68) were analyzed by immunoblot. Rabbit anti-PML shows several PML isoforms in both wt cells and double stable cells. Rabbit anti-Sp100 antibody also shows several Sp100 isoforms. The arrowheads indicate the bands representing PML-ECFP and EYFP-Sp100′ fusion proteins. (B) Fixed double stable cells were immunolabeled with mouse anti-PML antibody (5E10) and rabbit anti-Sp100 antibody (rSpGH). The projected 3D Z-stacks, collected using a DeltaVision RT microscope, show the colocalization of PML-ECFP and EYFP-Sp100′ fusion proteins with endogenous PML and Sp100 proteins, respectively. Bar, 10 μm.
Figure 2.
Figure 2.
4D tracking of PML NBs from prophase to prometaphase in living cells. (A) Double stable cells, CpYs68, stably expressing PML-ECFP and EYFP-Sp100′. Chromatin was visualized by Hoechst 33342 staining. A 7-μm Z-stack of 0.5-μm steps were collected in the CFP and YFP channels every 8 s for 26 min. One Z-section at the middle of the cell was collected in the Hoechst channel, at each time point, as the reference image for DNA. The 3D-projected still images of selected time points are shown here. Each PML NB was manually assigned a number and tracked by TIKAL 4D viewer to determine their displacement. The examples of PML NBs with different motions are indicated by colored arrowheads. The red arrowhead, directed motion. White arrowhead, diffusive motion. Blue arrowhead, constrained motion. Red, pseudocolored PML-ECFP. Green, EYFP-Sp100′. Blue, DNA stained by Hoechst 33342. Bar, 10 μm. (B) The trajectories of bodies were exported into MATLAB to calculate the MSD, which is plotted in the y-axis against Δt in the x-axis. The MSD is fitted to the power law MSD = 6DΔtα, with α as the coefficient of anomalous diffusion. A nonlinear relationship between the MSD and Δt indicates nonstandard diffusion. Classification into movement types is performed according to α ∼ 1.5 for directed movement, α ∼ 1 for simple diffusion, and α ∼ 0.5 for constrained diffusion. The representative MSD plot of each movement type is displayed here with the actual data (blue circles) and the fitted curve (red line). (C) Overview of the trajectory of each PML NB in this 4D image data set is summarized by ball-and-stick representations to show the displacement of each body. The initial position of each PML NB is indicated by a green volume.
Figure 3.
Figure 3.
Summary of PML NB movement types in interphase and prophase. (A) An example of a MSD plot, showing a biphasic curve. The green line shows the real data and the blue line shows the fitted curve. The red arrows indicate the two phases. (B) The box plots summarize the movement types of PML NBs from interphase cells (n = 10) and prophase cells (n = 20). The y-axis indicates the percentage of PML NB population that exhibits certain movement types and x-axis indicates the data from different phases, interphase (I), phase 1 of prophase (P1), phase 2 of prophase (P2). The red line indicates the median of the data set. The box indicates 50% of the data points. The notch of the box indicates the significance of the mean values with 95% confidence. If the notch area overlaps between the two sets, the mean values of the two sets are not significantly different. If there is no overlap, the difference is significant. Subtrack distributions of diffusion coefficient (C) and coefficient of anomalous diffusion (D) from interphase cells (red bars) and prophase cells (blue bars). Each track is divided by the breakpoints, which is defined by the change of diffusion coefficient, into subtracks. The α exponent was then calculated for each subtrack. A shift of both D and α value from the interphase cell to the prophase cell data set is observed. (E) Velocity is defined by displacement over time interval at each time point. A shift is also observed from the interphase cell to the prophase cell data set.
Figure 4.
Figure 4.
PML NB dynamics upon calyculin A induced premature chromosome condensation. A double stable cell line, CpYs68, was transiently transfected with H2A-mCherry construct. Cells were then treated with 40 nM calyculin A for 30 min to induce premature chromatin condensation before 4D live cell imaging by the DeltaVision RT microscope (n = 10). A 24-μm Z-stack of 1.5-μm steps was taken in the CFP and mCherry channels every 10 s for 8 min. The 3D-projected still images from selected time points are shown here. Condensed chromosomes can be visualized by the H2A-mCherry fluorescent signal (pseudocolored in green). PML NBs (pseudocolored in red, the white arrowheads) do not exhibit dynamic movement within the increased interchromatin space. Bar, 10 μm.
Figure 5.
Figure 5.
PML NBs dynamics upon nuclear membrane breakdown. (A) Triple stable cell line, CpYsRi89, stably expressing PML-ECFP, EYFP-Sp100′, and IBB-HcRed. An 8-μm Z-stack of 0.5-μm steps is collected every 8 s for 20 min in the YFP and the HcRed channels. A single Z section at the middle of the cell was taken at every time point in the Hoechst channel as the reference image for DNA. Nuclear membrane breakdown was visualized by the release of the HcRed signal from the nucleus into the cytoplasm. The 3D-projected images show that PML NBs are highly dynamic even before nuclear membrane breakdown. White arrowheads, PML NBs with long-distance displacement. Red arrowheads, the fusion of PML NBs. Bar, 10 μm. (B) The change of diffusion coefficient, calculated by a model-free maximum-likelihood estimator (MLE) algorithm, was used to define break points of a single particle track. Six live cell data sets were collected from the CpYsRi89 triple stable cell line. By visualizing the release of the HcRed signal from the nucleus into the cytoplasm, the time point of NEBD for each data set was defined as time = 0 to synchronize and compare timing between the data sets. The majority of the break points occurred before NEBD.
Figure 6.
Figure 6.
Correlations between PML NB mobility and chromatin colocalization. Four parameters were measured for each signal particle track and plotted over time. The change of chromatin intensity (I) indicates the change of colocalization between PML NBs and chromatin, and the variation of velocity (v), diffusion coefficient (D), and coefficient of anomalous diffusion (α) indicate the change of PML NB mobility. Three types of correlations can be typically observed in a prophase cell. One example track of each type is shown here. The y-axis on the left is the actual value of I, v, and D in a log scale. The y-axis on the right is α in a linear scale. (A) Attached, a PML NB was attached to chromatin and moved along with chromatin. (B) Detached, a PML NB was released from chromatin and showed increase mobility. (C) Reattached, a PML NB was released from chromatin but then reattached to chromatin at a later time.
Figure 7.
Figure 7.
PML NB dynamics upon nuclear entry of cyclin B1. (A) Double stable cell line, CpYcb165, stably expresses PML-ECFP and EYFP-cyclin B1. Cells were transiently transfected with H2A-mCherry construct. An 8-μm Z-stack of 0.5-μm steps was collected every 8 s for 30 min in the CFP and YFP channels. The 3D-projected images show that PML NBs exhibited limited movement before cyclin B1 entered the nucleus. After the nuclear entry of cyclin B1, PML NBs became dynamic, and long distance displacement and fusion of PML NBs were observed. White arrowheads, PML NBs with long-distance displacement. Red arrowheads, the fusion of PML NBs. Bar, 10 μm. (B) The change of diffusion coefficient, calculated by a model-free MLE algorithm, was used to define break points of a single particle track. Eight live cell data sets from the CpYcb165 double stable cell line were synchronized to the time point of cyclin B1 nuclear entry (time = 0). The majority of the break points occurred after nuclear entry of cyclin B1.
Figure 8.
Figure 8.
The formation of PML NBs in G1 cells occurs upon the establishment of a functional nuclear envelope. (A) Double stable cell line, CpYs68, expressing PML-ECFP (blue) and EYFP-Sp100′ (green) was transiently transfected with IBB-HcRed (red). A 20-μm Z-stack of 1.0-μm steps was taken every 1 min for 180 min in three channels. The establishment of a functional nuclear membrane can be visualized by the import of the HcRed signal from the cytoplasm into the nucleus. The 3D-projected images show that the entry of Sp100′ protein into the daughter nuclei occurs after the establishment of a functional nuclear envelope. The recruitment of Sp100′ into the PML NBs occurs much later than the recruitment of Sp100′ protein into the nuclei (white arrowheads). (B) Single stable cell line, Cp89, expressing PML-ECFP (blue) was transiently transfected with EYFP-Daxx (green) and IBB-HcRed (red). A 20-μm Z-stack of 1.0-μm steps was taken every 1.5 min for 300 min in three channels. The establishment of a functional nuclear membrane was visualized by the import of the HcRed signal from the cytoplasm into the nucleus. The 3D-projected images show a long delay of Daxx nuclear entry after the establishment of a functional nuclear envelope. The normal interphase localization of Daxx was reestablished much later, well into G1 phase (white arrowhead). Bar, 10 μm.

References

    1. Albiez H., et al. Chromatin domains and the interchromatin compartment form structurally defined and functionally interacting nuclear networks. Chromosome Res. 2006;14:707–733. - PubMed
    1. Asakawa Y., Gotoh E. A method for detecting sister chromatid exchanges using prematurely condensed chromosomes and immunogold-silver staining. Mutagenesis. 1997;12:175–177. - PubMed
    1. Bacher C. P., Reichenzeller M., Athale C., Herrmann H., Eils R. 4-D single particle tracking of synthetic and proteinaceous microspheres reveals preferential movement of nuclear particles along chromatin-poor tracks. BMC Cell Biol. 2004;5:45. - PMC - PubMed
    1. Bassermann F., Peschel C., Duyster J. Mitotic entry: a matter of oscillating destruction. Cell Cycle. 2005;4:1515–1517. - PubMed
    1. Bernardi R., Pandolfi P. P. Structure, dynamics and functions of promyelocytic leukaemia nuclear bodies. Nat. Rev. Mol. Cell Biol. 2007;8:1006–1016. - PubMed

Publication types