. 2008 Aug 1;112(3):875-85.
doi: 10.1182/blood-2007-12-126938. Epub 2008 May 14.

Decreased differentiation of erythroid cells exacerbates ineffective erythropoiesis in beta-thalassemia

Affiliations

Decreased differentiation of erythroid cells exacerbates ineffective erythropoiesis in beta-thalassemia

Ilaria V Libani et al. Blood. .

Abstract

In beta-thalassemia, the mechanism driving ineffective erythropoiesis (IE) is insufficiently understood. We analyzed mice affected by beta-thalassemia and observed, unexpectedly, a relatively small increase in apoptosis of their erythroid cells compared with healthy mice. Therefore, we sought to determine whether IE could also be characterized by limited erythroid cell differentiation. In thalassemic mice, we observed that a greater than normal percentage of erythroid cells was in S-phase, exhibiting an erythroblast-like morphology. Thalassemic cells were associated with expression of cell cycle-promoting genes such as EpoR, Jak2, Cyclin-A, Cdk2, and Ki-67 and the antiapoptotic protein Bcl-X(L). The cells also differentiated less than normal erythroid ones in vitro. To investigate whether Jak2 could be responsible for the limited cell differentiation, we administered a Jak2 inhibitor, TG101209, to healthy and thalassemic mice. Exposure to TG101209 dramatically decreased the spleen size but also affected anemia. Although our data do not exclude a role for apoptosis in IE, we propose that expansion of the erythroid pool followed by limited cell differentiation exacerbates IE in thalassemia. In addition, these results suggest that use of Jak2 inhibitors has the potential to profoundly change the management of this disorder.


Figures
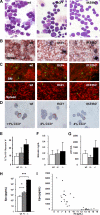
Figure 1
Figure 1
In β-thalassemic mice, there is a decreased number of differentiated cells, a small increase of apoptotic and hemolytic markers, and elevated production of Epo. (A) In cytospins of purified splenic erythroid cells, distinctive types of cells can be seen representing different stages of maturation. More mature cells are characterized by a smaller size, decreased cytoplasmic basophilia, and an increase in nuclear pyknosis. (May-Grünwald Giemsa stain; magnification, 400×.) These observations were corroborated by FACS analyses (Figures S1,S2). Apoptosis was investigated (B) by CC3 assay on spleen sections; (C) by TUNEL assay on BM and spleen sections; (D) by CC3 assay on purified erythroid cells; and (E) by annexin-V assay on fresh spleen and BM cells (data not shown; n ≥ 3 per genotype). For panels A through D, images were captured on a Nikon Eclipse E800 microscope (Melville, NY), with a Retiga Exi camera (Qimaging, Burnaby, BC) and a Plan Fluor 40×/0.75 numeric aperture objective, then acquired using the IPLab 3.65a software (Scanalytics, Fairfax, VA). Brightness/contrast and color balance were adjusted using Adobe Photoshop 7.0.1 (Adobe Systems, San Jose, CA). The levels of hemolytic markers (F) bilirubin and (G) LDH were also investigated (n ≥ 6 per genotype). In panels E-G, th3/+ and th3/th3 mice are indicated as +/− and −/−, respectively. A nonparametric t test was used for statistical analysis. Increased Epo levels inversely correlate with those of hemoglobin in thalassemic mice. Measurements were made of (H) Epo levels in mice 2 months after BMT and (I) Epo and Hb levels in mice up to 1 year of age. In panel H, a nonparametric t test was used for statistical analysis; n ≥ 3 per genotype; P = .037 (*) and P = .001 (***), respectively, for th3/+ and th3/th3 mice compared with wt animals. In this panel th3/+ and th3/th3 mice are indicated, respectively, as +/− and −/−. In panel I, increased Epo levels inversely correlate with Hb in thalassemic mice. Epo levels were measured in random mice up to 1 year of age or 1 year after BMT in wt (□, n = 17) and th3/+ (▲, n = 18) mice. Pearson r test was used to determine the degree of linear association or the correlation coefficient between the Hb and Epo levels (wt, nonsignificant, P = .087; th3/+, P = .027). Error bars represent SD.
Figure 2
Figure 2
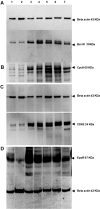
Increased amount of antiapoptotic and cell cycle–related proteins in purified wt and thalassemic erythroid cells. Representative Western blots performed on cells from wt (lanes 1,2), th3/+ (lanes 3,4), and th3/th3 (lanes 5,6) mice, and control cell lines (lane 7) probed with (A) Bcl-XL (control: NIH-3T3 cells), (B) CycA (control: Mel cells); (C) Cdk2 (control: Mel cells); and (D) EpoR (control: K562 cells). The upper band in panel A is described as the deamidated form of the protein. Bcl-XL deamidation has been shown to produce a complete loss of the antiapoptotic function of Bcl-XL. Similar ratios of the 2 bands are present in both normal and thalassemic mice. The membrane used for Bcl-XL was reprobed with CycA antibody. Specific antibodies against the phosphorylated and nonphosphorylated forms of the protein were used sequentially. In all cases, the same membranes were reprobed against β-actin as a loading control.
Figure 3
Figure 3
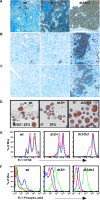
Increased number of cycling and undifferentiated erythroid cells in thalassemic versus healthy mice. Immunostaining for Ki-67 on spleen (A) and liver (B) specimens and for Mcm3 on liver (C) showed an increased number of cycling and undifferentiated cells in extramedullary sites of thalassemic mice (magnification, 400×). Mcm3 was also probed on spleen sections and the pattern was very similar to that observed for Ki-67 (data not shown). In particular, thalassemic liver sections showed an increased number of proliferating cells in areas associated with EMH. Cyclin-B1 staining (data not shown) confirmed that more proliferating cells are present in the spleens of thalassemic compared with wt mice. (D) Staining and analysis of cytospins of purified splenic erythroid cells after injection of BrdU in vivo showed that there is an increased percentage of cycling erythroid cells in β-thalassemic mice compared with healthy (20%, 30%, and 40% in wt, th3/+, and th3/th3, respectively; magnification, 400×). For panels A through D, images were captured on a Nikon Eclipse E800 microscope with a Retiga Exi camera (Qimaging) and a Plan Fluor 40×/0.75 numerical aperture objective, then acquired using the IPLab 3.65a software (Scanalytics). Brightness/contrast and color balance were adjusted using Abobe Photoshop 7.0.1 (Adobe Systems). (E) FACS analysis of CFSE-treated cells costained with antibodies to CD71 and Ter119. Erythroid cells from wt mice cultured in the presence of colcemid (purple line) or AG490 (blue line) showed little difference from untreated cells (pink line). Staining with 7-AAD, PI, and annexin-V excluded dead or apoptotic cells (n = 4 per genotype). After 48 hours, no further cell expansion was observed; instead there is a decline in cell number, indicating that these cells did not have an intrinsic self-sustaining ability to proliferate under these tissue culture conditions. (F) FACS analysis of freshly purified erythroid cells using an antibody that recognizes the phosphorylated form of Jak2 (green line). The blue line represents the cells stained with the isotype. As a control for the specificity of the antibody, the same cells were stained with the antibody after preincubation with the competitor peptide (red line, n = 3 per genotype).
Figure 4
Figure 4
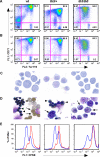
Thalassemic erythroid cells differentiated less than similar immature normal erythroid cells in vitro. (A) FACS analysis of wt, th3/+, and th3/th3 splenic erythroid cells before erythroid cell selection. Wt and th3/+ mice were phlebotomized as described in Document S1. (B) FACS analysis was repeated after selection. Numbers on plots are percentages of total cells in the respective gates. (C) Cytospin analysis at time 0 and (D) after culturing the cells for 48 hours in the presence of Epo. Wt cells are all tolidine positive, with the presence of extruded nuclei (arrowhead), and bright tolidine-positive reticulocytes (arrow). The th3/+ sample is characterized by the presence of hemoglobinized polychromatic-orthochromatic erythroblasts (arrowhead), and some rare proerythroblasts (arrow). In the th3/th3 sample, only proerythroblasts/early basophilic erythroblasts (arrow) were detectable, with no presence of tolidine-positive or enucleated cells. For panels C and D, a Plan Fluor 100×/0.75 numeric aperture oil objective was used, along with the same microscope, camera, and software as in Figure 1. (E) CFSE analysis of the erythroid populations. Erythroid cells cultured in the presence of colcemid plus Epo (purple line) or Epo alone (blue line).
Figure 5
Figure 5
TG101209, a Jak-2 inhibitor, reduced splenomegaly in thalassemic mice. Representative FACS analysis of 6-week-old th3/+ mice injected for 10 days with TG101209 or placebo, as indicated. The corresponding spleens and the Hb levels are shown. Numbers on plots are percentages of total cells in the respective gates. The weight of the spleens of these and other animals treated with TG101209 or placebo is indicated in Figure S5.
Figure 6
Figure 6
Increased number of proliferating erythroid cells in human thalassemic specimens. (A) At the end of the 2-phase liquid culture, the absolute expression of Bcl-XL, EpoR, Ki-67, CycA, and Jak2 mRNA relative to 14S ribosomal control RNA was quantified in 11 patients (black) and 6 healthy controls (white). An unpaired t test was used for statistical analysis. Benzidine staining was used to evaluate the level of erythroid differentiation. Both the amounts of β-globin mRNAs and those of cell cycle–related genes were quantified by quantitative polymerase chain reaction assay. We also performed highperformance liquid chromatography (HPLC) to determine variations in the percentages and absolute amounts of adult Hb in treated and nontreated samples (not shown). Error bars represent SD. (B) Time dependence of proliferating erythroid cells from 3 thalassemic patients (light gray, gray, and black) and one control subject (white). Aliquots of cells after various days of culture (second phase), corresponding to different stages of erythroid differentiation, were collected, cytospun, and stained for the proliferative marker Ki-67. Thalassemic patients showed an increased number of proliferating cells. More than 300 cells were counted to obtain the percentage of Ki-67–positive cells in each aliquot. (C) Spleen sections from a healthy subject (traumatic rupture) and a thalassemic patient (transfused thalassemia intermedia) who underwent splenectomy. Top panels: Ki-67 staining (brown; magnification, 100×). Bottom panels: Ki-67 (brown) and a mixture of glycophorin C and alpha-1-spectrin (red; magnification, 400×). A Plan Fluor 10×/0.30 numeric aperture objective and a Plan Fluor 40×/0.75 numeric aperture objective were used, along with the same microscope, camera, and software as in Figure 1.

Comment in

References

    1. Cooley TB, Lee P. A series of cases of splenomegaly in children with anemia and peculiar bone changes. Trans Am Pediatr Soc. 1925;37:29.
    1. Weatherall DJ. Single gene disorders or complex traits: lessons from the thalassaemias and other monogenic diseases. BMJ. 2000;321:1117–1120. - PMC - PubMed
    1. Weatherall DJ. Phenotype-genotype relationships in monogenic disease: lessons from the thalassaemias. Nat Rev Genet. 2001;2:245–255. - PubMed
    1. Steinberg MH, Forget BG, Higgs DR, Nagel RL. Cambridge, United Kingdom: Cambridge University Press; 2001. Disorders of Hemoglobin: Genetics, Pathophysiology and Clinical Management.
    1. Thein SL. Pathophysiology of {beta} thalassemia: a guide to molecular therapies. Hematology (Am Soc Hematol Educ Program) 2005:31–37. - PubMed

Publication types