. 2008 Jul;82(14):6992-7008.
doi: 10.1128/JVI.00661-08. Epub 2008 May 14.

Aberrant lymphocyte activation precedes delayed virus-specific T-cell response after both primary infection and secondary exposure to hepadnavirus in the woodchuck model of hepatitis B virus infection

Affiliations

Aberrant lymphocyte activation precedes delayed virus-specific T-cell response after both primary infection and secondary exposure to hepadnavirus in the woodchuck model of hepatitis B virus infection

Shashi A Gujar et al. J Virol. 2008 Jul.

Abstract

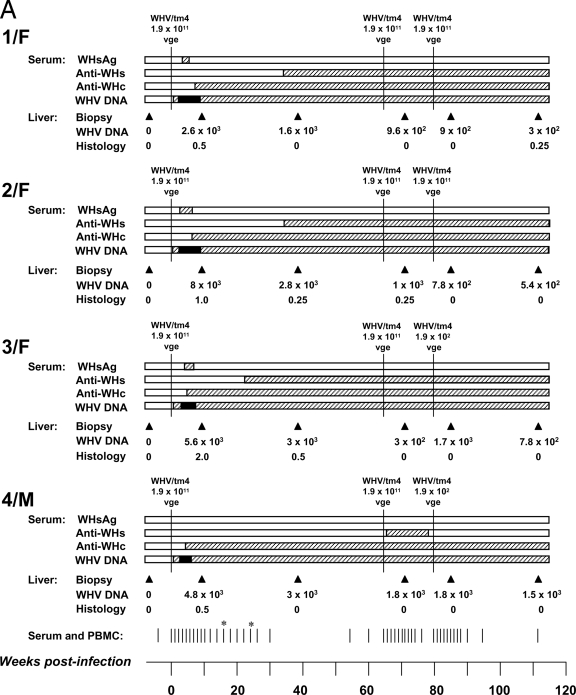
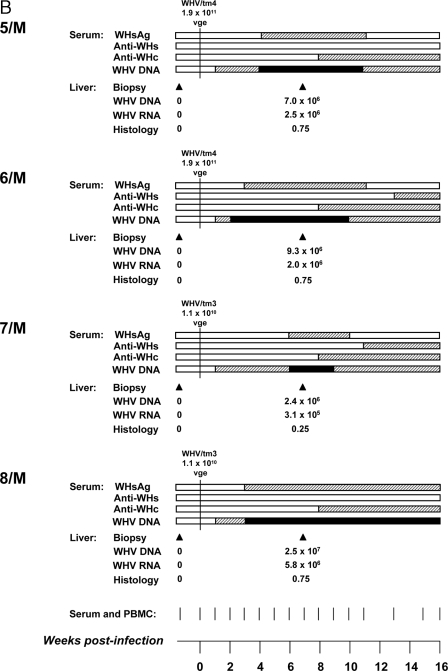
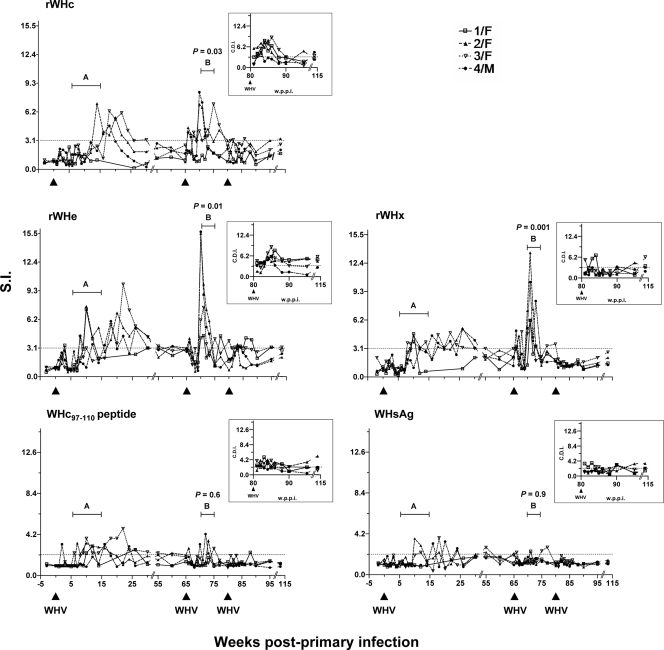
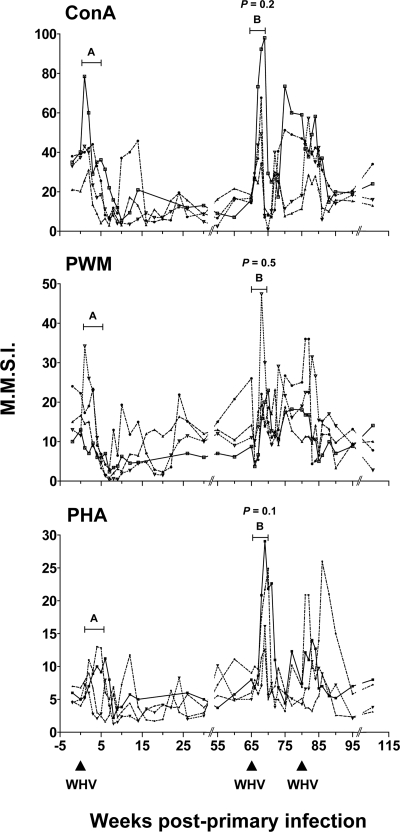
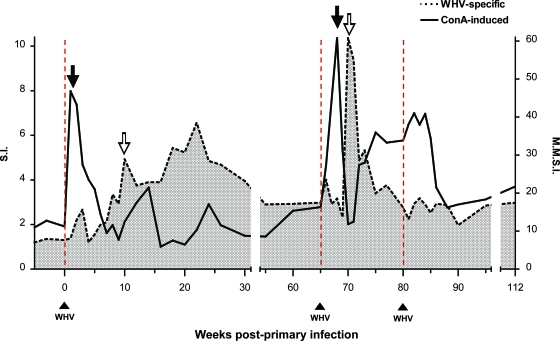
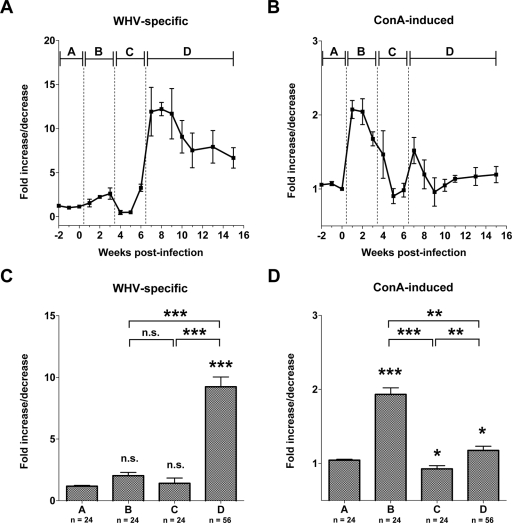
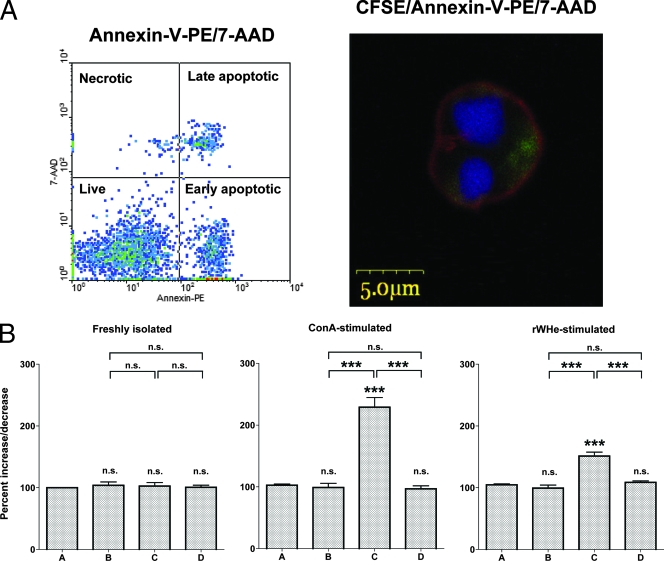
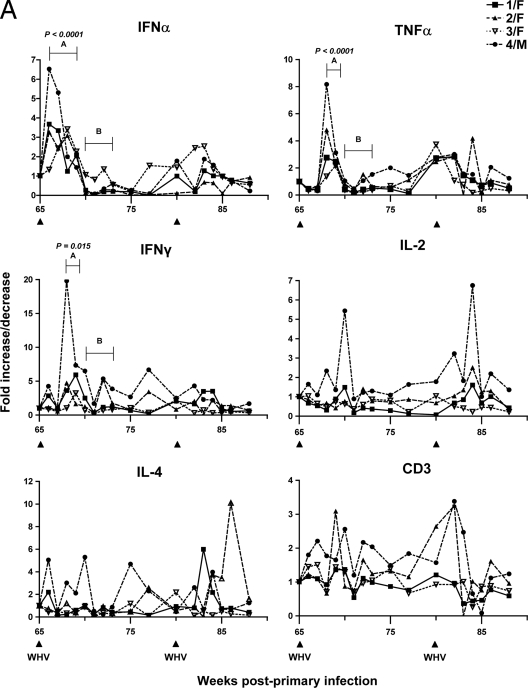
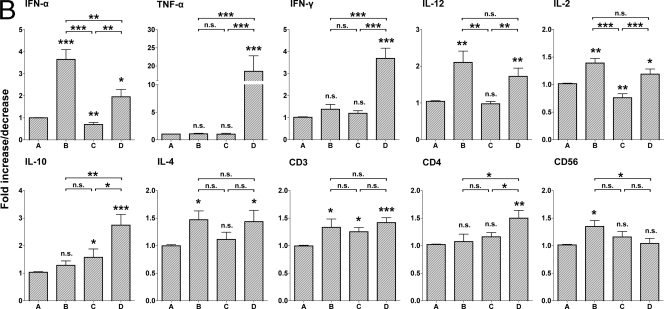
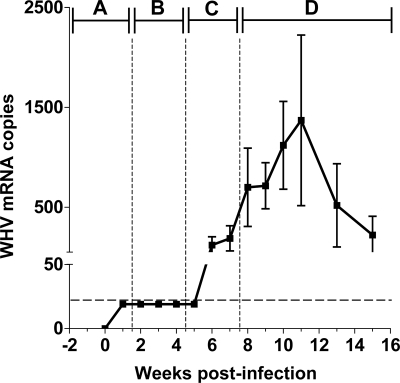
The contribution of virus-specific T lymphocytes to the outcome of acute hepadnaviral hepatitis is well recognized, but a reason behind the consistent postponement of this response remains unknown. Also, the characteristics of T-cell reactivity following reexposure to hepadnavirus are not thoroughly recognized. To investigate these issues, healthy woodchucks (Marmota monax) were infected with liver-pathogenic doses of woodchuck hepatitis virus (WHV) and investigated unchallenged or after challenge with the same virus. As expected, the WHV-specific T-cell response appeared late, 6 to 7 weeks postinfection, remained high during acute disease, and then declined but remained detectable long after the resolution of hepatitis. Interestingly, almost immediately after infection, lymphocytes acquired a heightened capacity to proliferate in response to mitogenic (nonspecific) stimuli. This reactivity subsided before the WHV-specific T-cell response appeared, and its decline coincided with the cells' augmented susceptibility to activation-induced death. The analysis of cytokine expression profiles confirmed early in vivo activation of immune cells and revealed their impairment of transcription of tumor necrosis factor alpha and gamma interferon. Strikingly, reexposure of the immune animals to WHV swiftly induced hyperresponsiveness to nonspecific stimuli, followed again by the delayed virus-specific response. Our data show that both primary and secondary exposures to hepadnavirus induce aberrant activation of lymphocytes preceding the virus-specific T-cell response. They suggest that this activation and the augmented death of the cells activated, accompanied by a defective expression of cytokines pivotal for effective T-cell priming, postpone the adaptive T-cell response. These impairments likely hamper the initial recognition and clearance of hepadnavirus, permitting its dissemination in the early phase of infection.


Figures

FIG. 1.
FIG. 1.
General outline of the experimental protocols showing time points of injections with WHV and of collection of serum, PBMC, and liver biopsy samples; serological markers of WHV infection and serum WHV DNA detected; hepatic WHV loads; and the results of liver histology after primary infection and challenge with WHV. (A) Four woodchucks (study group A) were infected (time zero) with 1.9 × 10¹¹ DNase-protected virions of WHV/tm4 inoculum, challenged with the same WHV dose at week 65, and then rechallenged with either 1.9 × 10¹¹ (animals 1/F and 2/F) or 1.9 × 10² (animals 3/F and 4/M) virions at week 80. (B) Four woodchucks (study group B) were infected (time zero) with 1.9 × 10¹¹ virions of WHV/tm4 (animals 5/M and 6/M) or with 1.1 × 10¹⁰ virions of WHV/tm3 (animals 7/M and 8/M) and followed for 16 weeks after infection. The appearance and the duration of WHsAg, anti-WHs, anti-WHc, and serum WHV DNA are shown by horizontal bars. The estimated levels of serum WHV DNA are depicted as black bars (≥103 vge/ml), hatched bars (≤103 vge/ml), or white bars (not detectable). The PBMC collected at the time points marked by the short vertical lines at the bottom of panels A and B were analyzed for WHV-specific and generalized T-cell proliferative responses. Samples marked with an asterisk were obtained from all woodchucks except 1/F. The WHV DNA load (A and B) and WHV RNA load (B) in liver biopsies collected at the time points indicated by solid arrow heads are presented as the estimated WHV DNA vge/μg of total liver DNA and WHV RNA copies/μg of total liver RNA, respectively. Liver morphological alterations are presented as the histological degree of hepatitis graded on a scale of 0 to 3.
FIG. 1.
FIG. 1.
General outline of the experimental protocols showing time points of injections with WHV and of collection of serum, PBMC, and liver biopsy samples; serological markers of WHV infection and serum WHV DNA detected; hepatic WHV loads; and the results of liver histology after primary infection and challenge with WHV. (A) Four woodchucks (study group A) were infected (time zero) with 1.9 × 10¹¹ DNase-protected virions of WHV/tm4 inoculum, challenged with the same WHV dose at week 65, and then rechallenged with either 1.9 × 10¹¹ (animals 1/F and 2/F) or 1.9 × 10² (animals 3/F and 4/M) virions at week 80. (B) Four woodchucks (study group B) were infected (time zero) with 1.9 × 10¹¹ virions of WHV/tm4 (animals 5/M and 6/M) or with 1.1 × 10¹⁰ virions of WHV/tm3 (animals 7/M and 8/M) and followed for 16 weeks after infection. The appearance and the duration of WHsAg, anti-WHs, anti-WHc, and serum WHV DNA are shown by horizontal bars. The estimated levels of serum WHV DNA are depicted as black bars (≥103 vge/ml), hatched bars (≤103 vge/ml), or white bars (not detectable). The PBMC collected at the time points marked by the short vertical lines at the bottom of panels A and B were analyzed for WHV-specific and generalized T-cell proliferative responses. Samples marked with an asterisk were obtained from all woodchucks except 1/F. The WHV DNA load (A and B) and WHV RNA load (B) in liver biopsies collected at the time points indicated by solid arrow heads are presented as the estimated WHV DNA vge/μg of total liver DNA and WHV RNA copies/μg of total liver RNA, respectively. Liver morphological alterations are presented as the histological degree of hepatitis graded on a scale of 0 to 3.
FIG. 2.
FIG. 2.
Kinetics of the WHV-specific T-cell proliferative response against WHV antigens in woodchucks from study group A which were infected, challenged, and rechallenged with WHV. The animals were injected with WHV at the time points indicated by solid arrow heads. Freshly isolated PBMC were stimulated in vitro with rWHc, rWHe, rWHx, WHc97-110 peptide, or WHsAg, and their proliferation measured by [3H]adenine incorporation assay. The results are presented as the SI. P values were calculated for peak T-cell reactivity against each WHV antigen in each animal observed during primary (A) and secondary (B) virus exposure in the time periods marked by vertical short lines. The insets show T-cell proliferative responses against the same WHV antigens after rechallenge with WHV as measured by CFSE flow cytometry assay, with the results presented as the CDI. The cutoff values for positive responses against rWHc, rWHe, and rWHx were ≥3.1 and against WHc97-110 peptide and WHsAg were ≥2.1, as indicated by horizontal dotted lines.
FIG. 3.
FIG. 3.
Kinetics of mitogen-induced (generalized) T-lymphocyte proliferation in woodchucks after primary infection, challenge, and rechallenge with WHV. The same animals (study group A) whose results are shown in Fig. 2 (see the key in Fig. 2) were injected with WHV at the time points indicated by solid arrow heads. The T-cell proliferation in response to five different concentrations of ConA, PWM, or PHA was measured by [3H]adenine incorporation assay. The MMSI values for each mitogen in each animal at the indicated time points were calculated as explained in Materials and Methods. P values were determined as described for Fig. 2.
FIG. 4.
FIG. 4.
Discordance between the kinetics of WHV-specific and generalized T-cell proliferative responses during primary WHV infection and after challenge and rechallenge with WHV. The profiles are compiled from the data generated using a [3H]adenine incorporation assay to measure T-cell proliferation in response to rWHc, rWHe, rWHx, WHc97-110 peptide, and WHsAg (SI values) and in response to five concentrations of ConA (MMSI values). The mean of the highest SI given by any WHV antigen or that of MMSI in response to any ConA concentration from each of four animals constituting study group A was used to construct the profiles of the WHV-specific and generalized T-cell responses, respectively. Solid and open downward arrows depict peaks of mitogen-induced or WHV-specific T-cell responsiveness, respectively, after primary infection and challenge with WHV. Solid upward arrowheads mark injections with WHV.
FIG. 5.
FIG. 5.
Patterns of WHV-specific and ConA-induced T-cell responses in group B woodchucks during self-limited acute WHV infection. (A) WHV-specific T-cell response to rWHe was measured by CFSE-based flow cytometric assay. The data are presented as the means ± standard errors of the means (SEM) of CDIs obtained for PBMC from all four animals that were measured after stimulation with 1 and 2 μg/ml rWHe at each time point indicated. (B) ConA-induced T-cell proliferative response was measured in the same samples by adenine incorporation assay using twofold dilutions of ConA ranging from 1.25 to 20 μg/ml. The MMSI was calculated by averaging the SIs from all five ConA concentrations for all four animals at each time point showed. The CDI or MMSI values detected after infection with WHV were compared with those from the same animal before infection (phase A) and are expressed as the n-fold increase or decrease. Each data point represents the mean ± SEM of n-fold increase/decrease from all four animals. The preinfection period (phase A) and stages of WHV infection (phases B to D) as defined in Materials and Methods are marked. The cumulative data on WHV-specific (C) and ConA-induced (D) T-cell proliferative responses detected during indicated phases of WHV infection are presented as means ± SEMs for n-fold increases or decreases. The data presented as bars B, C, and D were compared either with those presented as bar A or with each other. Differences marked with one asterisk were significant at a P value of <0.05, with two at a P value of <0.005, and with three at a P value of <0.0001. n.s., nonsignificant.
FIG. 6.
FIG. 6.
Activation-induced apoptosis of lymphoid cells during progression of acute WHV infection. (A) A representative flow cytometry dot plot and a confocal microscopy micrograph showing annexin V-PE- and 7-AAD-labeling patterns in circulating woodchuck lymphoid cells. Staining patterns of annexin V-PE, 7-AAD, and CFSE are visualized with red, blue, and green colors, respectively. (B) Freshly isolated or ConA- or rWHe-stimulated PBMC samples collected prior to inoculation with WHV (phase A) from group B animals or weekly during progression of acute infection were analyzed for the rate of apoptosis by using flow cytometry with annexin V and 7-AAD. The percentages of apoptotic cells were determined in each weekly sample from each of four animals, averaged to find the mean percentage of apoptosis for each phase of infection (phases B to D), and compared with that calculated for PBMC collected prior to WHV infection (phase A), which was taken as 100%. The bars represent the means ± standard errors of the means of percent increases or decreases in apoptosis for freshly isolated PBMC or those stimulated with ConA at 2.5 and 5 μg/ml or with rWHe at 1 and 2 μg/ml. Differences marked with one asterisk were significant at a P value of <0.05, with two at a P value of <0.005, and with three at a P value of <0.0001. n.s., nonsignificant.
FIG. 7.
FIG. 7.
Expression profiles of genes encoding cytokines and immune-cell surface markers in serial, unmanipulated PBMC samples collected from the woodchucks investigated. (A) Expression of IFN-α, IFN-γ, TNF-α, IL-4, IL-2, and CD3 in lymphomononuclear cell samples collected from group A animals after challenge and rechallenge with WHV. The solid arrow heads mark the time points of challenge or rechallenge with WHV/tm4. The peak levels of expression of IFN-α (66 to 69 w.p.p.i.) and IFN-γ and TNF-α (68 to 69 w.p.p.i.) were compared with those during enhanced WHV-specific response (70 to 74 w.p.p.i.), and P values were calculated as indicated in the legend to Fig. 2. (B) Transcription levels of IFN-α, TNF-α, IFN-γ, IL-12, IL-2, IL-10, IL-4, CD3, CD4, and CD56 in circulating lymphoid cells in different phases of acute WHV infection characterized by distinctive rWHe-specific and Con-A-induced T-cell responses in group B animals. The fold increase/decrease for each gene tested in a given phase of infection (indicated) was calculated and statistically compared as outlined in Materials and Methods. Differences marked with one asterisk were significant at a P value of <0.05, with two at a P value of <0.005, and with three at a P value of <0.0001. n.s., nonsignificant.
FIG. 7.
FIG. 7.
Expression profiles of genes encoding cytokines and immune-cell surface markers in serial, unmanipulated PBMC samples collected from the woodchucks investigated. (A) Expression of IFN-α, IFN-γ, TNF-α, IL-4, IL-2, and CD3 in lymphomononuclear cell samples collected from group A animals after challenge and rechallenge with WHV. The solid arrow heads mark the time points of challenge or rechallenge with WHV/tm4. The peak levels of expression of IFN-α (66 to 69 w.p.p.i.) and IFN-γ and TNF-α (68 to 69 w.p.p.i.) were compared with those during enhanced WHV-specific response (70 to 74 w.p.p.i.), and P values were calculated as indicated in the legend to Fig. 2. (B) Transcription levels of IFN-α, TNF-α, IFN-γ, IL-12, IL-2, IL-10, IL-4, CD3, CD4, and CD56 in circulating lymphoid cells in different phases of acute WHV infection characterized by distinctive rWHe-specific and Con-A-induced T-cell responses in group B animals. The fold increase/decrease for each gene tested in a given phase of infection (indicated) was calculated and statistically compared as outlined in Materials and Methods. Differences marked with one asterisk were significant at a P value of <0.05, with two at a P value of <0.005, and with three at a P value of <0.0001. n.s., nonsignificant.
FIG. 8.
FIG. 8.
WHV mRNA loads in serial, unmanipulated lymphoid-cell samples collected during different phases of acute WHV infection from group B animals. The total RNA isolated from weekly PBMC samples collected before (phase A) and after inoculation with WHV was reverse transcribed, and virus-specific transcripts quantified by real-time PCR. Phases of infection are indicated at the top. The data represent the means ± standard errors of the means of WHV RNA loads detected for all four woodchucks at each time point indicated. The horizontal line represents the detection limit of real-time RT-PCR (∼200 copies/μg of total RNA). When negative by real-time RT-PCR, samples were further analyzed by nested RT-PCR-NAH assay (sensitivity 2.5 to 5 copies/μg of total RNA).

Similar articles

Cited by

References

    1. Akbar, A. N., N. Borthwick, M. Salmon, W. Gombert, M. Bofill, N. Shamsadeen, D. Pilling, S. Pett, J. E. Grundy, and G. Janossy. 1993. The significance of low bcl-2 expression by CD45RO T cells in normal individuals and patients with acute viral infections. The role of apoptosis in T cell memory. J. Exp. Med. 178427-438. - PMC - PubMed
    1. Andoniou, C. E., S. L. van Dommelen, V. Voigt, D. M. Andrews, G. Brizard, C. Asselin-Paturel, T. Delale, K. J. Stacey, G. Trinchieri, and M. A. Degli-Esposti. 2005. Interaction between conventional dendritic cells and natural killer cells is integral to the activation of effective antiviral immunity. Nat. Immunol. 61011-1019. - PubMed
    1. Asselin-Paturel, C., A. Boonstra, M. Dalod, I. Durand, N. Yessaad, C. Dezutter-Dambuyant, A. Vicari, A. O'Garra, C. Biron, F. Brière, and G. Trinchieri. 2001. Mouse type I IFN-producing cells are immature APCs with plasmacytoid morphology. Nat. Immunol. 21144-1150. - PubMed
    1. Bertoletti, A., and C. Ferrari. 2003. Kinetics of the immune response during HBV and HCV infection. Hepatology 384-13. - PubMed
    1. Bertoletti, A., and A. J. Gehring. 2006. The immune response during hepatitis B virus infection. J. Gen. Virol. 871439-1449. - PubMed

Publication types

Substances