. 2008 Aug;65(8):595-613.
doi: 10.1002/cm.20283.

Live-cell analysis of mitotic spindle formation in taxol-treated cells

Affiliations

Live-cell analysis of mitotic spindle formation in taxol-treated cells

Jessica E Hornick et al. Cell Motil Cytoskeleton. 2008 Aug.

Abstract

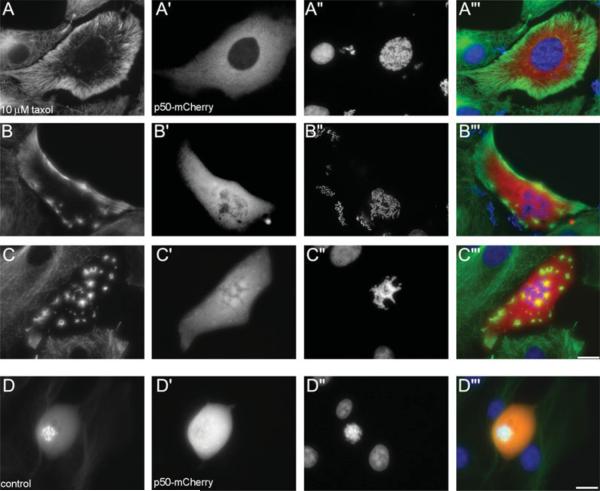
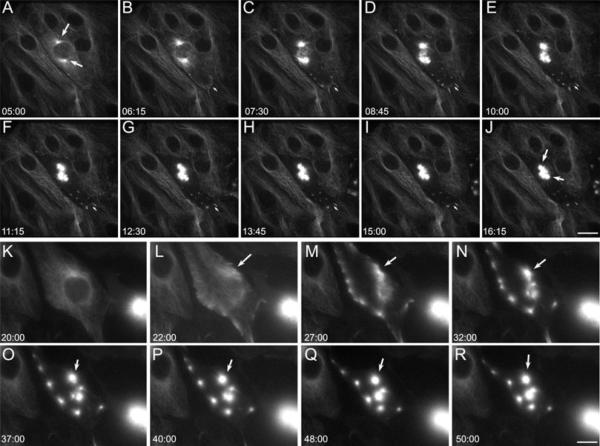
Taxol functions to suppress the dynamic behavior of individual microtubules, and induces multipolar mitotic spindles. However, little is known about the mechanisms by which taxol disrupts normal bipolar spindle assembly in vivo. Using live imaging of GFP-alpha tubulin expressing cells, we examined spindle assembly after taxol treatment. We find that as taxol-treated cells enter mitosis, there is a dramatic re-distribution of the microtubule network from the centrosomes to the cell cortex. As they align there, the cortical microtubules recruit NuMA to their embedded ends, followed by the kinesin motor HSET. These cortical microtubules then bud off to form cytasters, which fuse into multipolar spindles. Cytoplasmic dynein and dynactin do not re-localize to cortical microtubules, and disruption of dynein/dynactin interactions by over-expression of p50 "dynamitin" does not prevent cytaster formation. Taxol added well before spindle poles begin to form induces multipolarity, but taxol added after nascent spindle poles are visible-but before NEB is complete-results in bipolar spindles. Our results suggest that taxol prevents rapid transport of key components, such as NuMA, to the nascent spindle poles. The net result is loss of mitotic spindle pole cohesion, microtubule re-distribution, and cytaster formation.


Figures

Fig. 1
Fig. 1
Time-lapse imaging of BSC-1 αtg cells in taxol. A–O. Frames from a low-magnification video microscopy sequence showing a field of BSC-1 αtg cells as they progress into mitosis over a period of 19 h (time stamp in h:min). The cell denoted by the arrow is the first to enter mitosis (beginning in frame B). A close-up view of this cell is shown in the lower panels 1–12. Notice that spindle assembly begins as the microtubules are released from the MTOC, and move to the cell periphery (frames 4–6). Microtubules at the periphery shorten and form into cytasters (frames 7–9). As the cell rounds up, the asters move towards the cell center, and fuse together into a multipolar spindle (Frames 10–12). Fluorescence optics, Bar in A–O = 100 μm, Bar in 1–12 = 10 μm. (Blow-up of spindle/cyaster assembly from cell (designated by arrow above). Also see supplemental video 2.
Fig. 2
Fig. 2
Cytaster assembly and disassembly following taxol treatment. A–H. Fames from a time-lapse video sequence showing a BSC-1 αtg cell assembling asters from its cortex. Of the eleven cytasters that form from the cortex, seven migrate to the cell center and become part of the spindle, while four (marked with “*” in panel A) fail to migrate and depolymerized. The most prominent of the depolymerizing asters is denoted with an arrow (A–E). Despite forming a multipolar spindle, this cell cleaves into two distinct daughter cells when it eventually exits mitosis (arrowheads in H). Time stamp is h:min. Fluorescence optics. Bar = 20 μm.
Fig. 3
Fig. 3
Microtubule re-modeling in taxol-treated prophase cell. A–H. Frames from a video sequence showing microtubule re-distribution to the cell cortex and cytaster formation in vivo following taxol treatment. Note the formation of a major aster (arrow) from a curving sheet of cortically arrayed microtubules. Time stamp is Hrs:Min. Fluorescence optics. Bar = 20 μm. Also see supplemental video 3.
Fig. 4
Fig. 4
Microtubule asters forming and fusing at the cortex. A–H. Frames from a high-magnification time-lapse sequence showing the formation of cytasters at the cell cortex following taxol treatment. In frame A, there are three asters forming (arrow and arrowheads) that eventually fuse together. In B–C, the two asters denoted by the arrowheads fuse together. This aster—denoted by an arrowhead—fuses with the large aster denoted by the arrow (E–G). Bar = 3 μm. Also see supplemental video 4.
Fig. 5
Fig. 5
Localization of γ-tubulin/centrosomes in taxol-treated cells. Maximal projections of immunofluorescence images showing the localization of α-tubulin (A–D), γ-tubulin (A′–D′), and DAPI (A″–D″) of taxol treated cells. The three color overlays (A‴–D‴) depict microtubules in green, γ-tubulin in red, and dapi in blue. A–A‴. Early prophase taxol-treated cell. Note the two γ-tubulin positive centrosomes remain close together (A′, inset), and have wandered towards the cell periphery (arrow in A‴–C. Centrosome localization in multipolar cells. In B‴, the centrosomes do not have any detectable microtubules associated with them (arrows). In C‴, the major microtubule asters are not assembled around the two centrosomes (arrows). D. The two centrosomes do not appear to be influencing the organization of the spindle, which has adopted a rough bipolar configuration, but one with sister chromatids surrounding both poles. Bar in A‴–C‴ = 20 μm, in D‴ = 5μm.
Fig. 6
Fig. 6
Localization of NuMA and HSET in taxol-treated cells. Maximal projections of immunofluorescence images showing the localization of α-tubulin (A–G), NuMA (A′–D′), HSET (E′–G′), and DAPI (A″–G″) in taxol treated cells. A–D. In taxol-treated cells, NuMA translocates from the disintegrating nucleus to the cortically aligned microtubule ends (A′, arrows). Note that where there are no microtubules at the cortex, NuMA staining is lacking (B-B′, arrowhead). As the cortical microtubule sheets curve in and become asters, NuMA localizes to the inner surface of the forming asters (arrowhead in C″). NuMA decorates the inner surface of the large hollow asters that form (arrows in D′–G. the minus-end directed kinesin HSET localizes to microtubules ends. E-E‴ shows a prophase cells. HSET does not decorate the cortex except where a small aster is forming (E′, arrow). As the microtubules align and shorten at the cell cortex, HSET decorates the embedded ends (F′) and the asters as they assemble (G′). Bars in D‴ and G‴ = 20 μm.
Fig. 7
Fig. 7
Localization of cytoplasmic dynein and dynactin in taxol-treated cells. Maximal projections of immunofluorescence images showing the localization of α-tubulin (A–F), cytoplasmic dynein intermediate chain (A′–C′), p150 subunit of dynactin (D′–F′), and DAPI (A″–F″) in taxol treated cells. A–C. Dynein localizes to the kinetochores (A′, inset), but does not decorate the cortical regions. Dynein does decorate the center of asters after they have formed (C′, arrows). D–F. p150 also decorates kinetochores, as well as cytasters once they have formed. p150 does not localize to the cortex (A′). Bar = 10 μm.
Fig. 8
Fig. 8
Over-expression of p50 dynamitin in taxol-treated cells. Maximal projections of immunofluorescence images showing the localization of α-tubulin (A–D), p50 “dynamitin” coupled to mCherry fluorescent protein (A′–D′), and DAPI (A″–D″) in BSC-1 αtg cells. Over-expression of the p50 does not prevent microtubules from re-distributing to the cortex in response to taxol treatment (A), nor forming cytasters (B–C). Over-expression of p50 in un-treated cells results in mitotic spindle pole defects (D-D‴). This cell has assembled a monopolar spindle. Bar = 10 μm.
Fig. 9
Fig. 9
Spindle pole morphology in cells treated with taxol for 5 or 20 min. Maximal projection of immunofluorescent images showing spindle pole organization in cells treated with taxol for 5 min (A–B, and D–E) or 20 min (C–F). Cells were labeled with anti-NuMA to detect spindle poles (A′–C′), and anti-g tubulin to detect centrosomes (D′–F′). In those cells treated with taxol for 5 min, two spindle poles formed (A′–B′, arrows), and very little microtubule re-distribution to the cortex was observed. Such cells assembled the two microtubule foci around the centrosomes (D′–E′, arrows). In cells treated with taxol for 20 min, no major spindle poles were organized, and the centrosomes no longer organized the microtubule network (B and D). Bar in A‴ = 20 μm, in B‴–D‴ = 10 μm.
Fig. 10
Fig. 10
Live-cell analysis of spindle assembly in cells treated with taxol for 5 or 20 min. Frames from two time-lapse video sequences showing spindle assembly in a cell treated with taxol for 5 min (A–J) or 20 min (K–R). In the cell treated for 5 min, two spindle poles have formed, and these persist as the nuclear envelope breaks down (A, arrows). While the spindle does not have a normal appearance, it does remain bipolar (J, arrows). There are few microtubules re-distributing to the cortex (B–I, small arrow). In the cell treated for 20 min, the microtubules re-distribute to the cell cortex. The major cytaster formed is derived from cortically aligned microtubules (L–R, arrow). Time stamp is Min:Sec, and represents the time from taxol addition. Bar in J = 20 μm, in R = 10 μm.

Similar articles

Cited by

References

    1. Amin-Hanjani S, Wadsworth P. Inhibition of spindle elongation by taxol. Cell Motil Cytoskeleton. 1991;20:136–144. - PubMed
    1. Balczon R, Bao L, Zimmer WE, Brown K, Zinkowski RP, Brinkley BR. Dissociation of centrosome replication events from cycles of DNA synthesis and mitotic division in Hydroxyurea-arrested Chinese Hamster Ovary cells. J Cell Biol. 1995;130:105–115. - PMC - PubMed
    1. Cassimeris L, Pryer NK, Salmon ED. Real-time observations of microtubule dynamic instability in living cells. J Cell Biol. 1988;107:2223–2231. - PMC - PubMed
    1. Compton DA. Focusing on spindle poles. J Cell Sci. 1998;111:1477–1481. - PubMed
    1. Compton DA, Cleveland DW. NuMA, a nuclear protein involved in mitosis and nuclear reformation. Curr Opin Cell Biol. 1994;6:343–346. - PubMed

Publication types

MeSH terms