

Classification of childhood white matter disorders using proton MR spectroscopic imaging
- PMID: 18483189
- PMCID: PMC2944924
- DOI: 10.3174/ajnr.A1106
Classification of childhood white matter disorders using proton MR spectroscopic imaging
Abstract
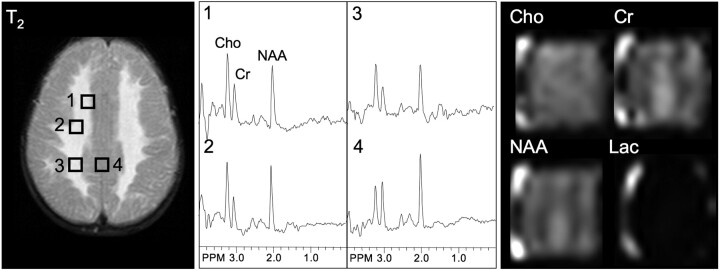
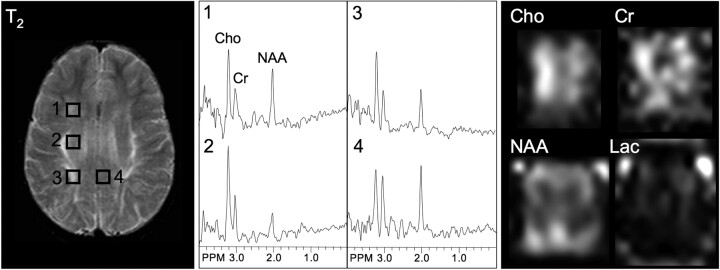
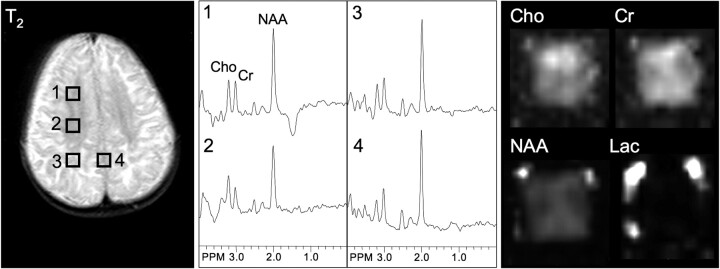
Background and purpose: Childhood white matter disorders often show similar MR imaging signal-intensity changes, despite different underlying pathophysiologies. The purpose of this study was to determine if proton MR spectroscopic imaging ((1)H-MRSI) may help identify tissue pathophysiology in patients with leukoencephalopathies.
Materials and methods: Seventy patients (mean age, 6; range, 0.66-17 years) were prospectively examined by (1)H-MRSI; a diagnosis of leukoencephalopathy due to known genetic defects leading to lack of formation, breakdown of myelin, or loss of white matter tissue attenuation (rarefaction) was made in 47 patients. The diagnosis remained undefined (UL) in 23 patients. Patients with definite diagnoses were assigned (on the basis of known pathophysiology) to 3 groups corresponding to hypomyelination, white matter rarefaction, and demyelination. Choline (Cho), creatine (Cr), and N-acetylaspartate (NAA) signals from 6 white matter regions and their intra- and intervoxel (relative to gray matter) ratios were measured. Analysis of variance was performed by diagnosis and by pathophysiology group. Stepwise linear discriminant analysis was performed to construct a model to predict pathophysiology on the basis of (1)H-MRSI, and was applied to the UL group.
Results: Analysis of variance by diagnosis showed 3 main metabolic patterns. Analysis of variance by pathophysiology showed significant differences for Cho/NAA (P < .001), Cho/Cr (P < .004), and NAA/Cr (P < .002). Accuracy of the linear discriminant analysis model was 75%, with Cho/Cr and NAA/Cr being the best parameters for classification. On the basis of the linear discriminant analysis model, 61% of the subjects in the UL group were classified as hypomyelinating.
Conclusion: (1)H-MRSI provides information on tissue pathophysiology and may, therefore, be a valuable tool in the evaluation of patients with leukoencephalopathies.
Figures

References
-
- Aubourg P. The leukodystrophies: a window to myelin. Nat Genet 1993;5:105–06 - PubMed
-
- van der Knaap MS, Valk J. Magnetic Resonance Myelination and Myelin Disorders. Berlin, Germany: Springer-Verlag;2005
-
- van der Knaap M, Breiter S, Naidu S. Defining and categorizing leukoencephalopathies of unknown origin: MR imaging approach. Radiology 1999;213:121–33 - PubMed
-
- Moroni I, Bugiani M, Bizzi A, et al. Cerebral white matter involvement in children with mitochondrial encephalopathies. Neuropediatrics 2002;33:79–85 - PubMed
Publication types
MeSH terms
Substances
Grants and funding
LinkOut - more resources
Full Text Sources
Medical