

Overexpression of lymphotoxin in T cells induces fulminant thymic involution
- PMID: 18483211
- PMCID: PMC2408416
- DOI: 10.2353/ajpath.2008.070572
Overexpression of lymphotoxin in T cells induces fulminant thymic involution
Erratum in
-
CORRECTION.Am J Pathol. 2024 Jun;194(6):1158-1159. doi: 10.1016/j.ajpath.2024.03.005. Epub 2024 Apr 3. Am J Pathol. 2024. PMID: 38749612 Free PMC article. No abstract available.
Abstract
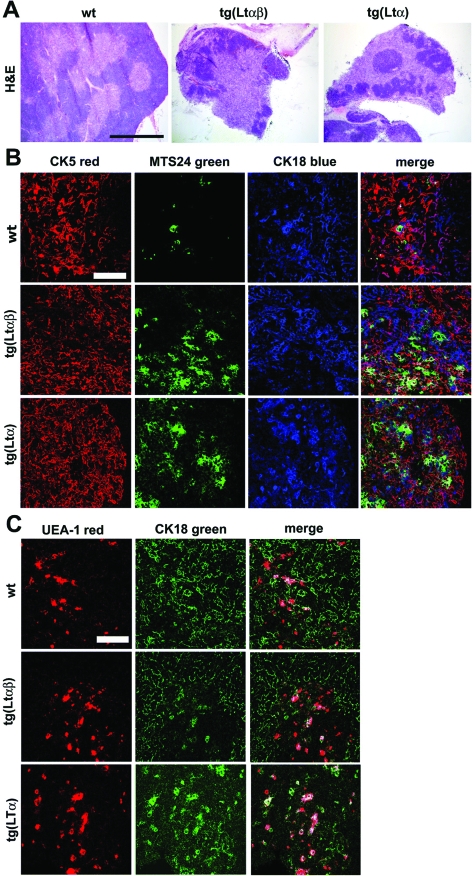
Activated lymphocytes and lymphoid-tissue inducer cells express lymphotoxins (LTs), which are essential for the organogenesis and maintenance of lymphoreticular microenvironments. Here we describe that T-cell-restricted overexpression of LT induces fulminant thymic involution. This phenotype was prevented by ablation of the LT receptors tumor necrosis factor receptor (TNFR) 1 or LT beta receptor (LTbetaR), representing two non-redundant pathways. Multiple lines of transgenic Ltalphabeta and Ltalpha mice show such a phenotype, which was not observed on overexpression of LTbeta alone. Reciprocal bone marrow transfers between LT-overexpressing and receptor-ablated mice show that involution was not due to a T cell-autonomous defect but was triggered by TNFR1 and LTbetaR signaling to radioresistant stromal cells. Thymic involution was partially prevented by the removal of one allele of LTbetaR but not of TNFR1, establishing a hierarchy in these signaling events. Infection with the lymphocytic choriomeningitis virus triggered a similar thymic pathology in wt, but not in Tnfr1(-/-) mice. These mice displayed elevated TNFalpha in both thymus and plasma, as well as increased LTs on both CD8(+) and CD4(-)CD8(-) thymocytes. These findings suggest that enhanced T cell-derived LT expression helps to control the physiological size of the thymic stroma and accelerates its involution via TNFR1/LTbetaR signaling in pathological conditions and possibly also in normal aging.
Figures


Similar articles
-
Accelerated thymic atrophy as a result of elevated homeostatic expression of the genes encoded by the TNF/lymphotoxin cytokine locus.Eur J Immunol. 2009 Oct;39(10):2906-15. doi: 10.1002/eji.200839191. Eur J Immunol. 2009. PMID: 19735075
-
Increased thymic B cells but maintenance of thymic structure, T cell differentiation and negative selection in lymphotoxin-alpha and TNF gene-targeted mice.Dev Immunol. 2000;8(1):61-74. doi: 10.1155/2000/13492. Dev Immunol. 2000. PMID: 11293812 Free PMC article.
-
Distinct contributions of TNF and LT cytokines to the development of dendritic cells in vitro and their recruitment in vivo.Blood. 2003 Feb 15;101(4):1477-83. doi: 10.1182/blood.V101.4.1477. Blood. 2003. PMID: 12560241
-
Biology and signal transduction pathways of the Lymphotoxin-αβ/LTβR system.Cytokine Growth Factor Rev. 2011 Oct-Dec;22(5-6):301-10. doi: 10.1016/j.cytogfr.2011.11.007. Cytokine Growth Factor Rev. 2011. PMID: 22152226 Review.
-
The unconventional role of LT alpha beta in T cell differentiation.Trends Immunol. 2007 Apr;28(4):169-75. doi: 10.1016/j.it.2007.02.005. Epub 2007 Mar 1. Trends Immunol. 2007. PMID: 17336158 Review.
Cited by
-
The purinergic P2Y14 receptor axis is a molecular determinant for organism survival under in utero radiation toxicity.Cell Death Dis. 2013 Jul 4;4(7):e703. doi: 10.1038/cddis.2013.218. Cell Death Dis. 2013. PMID: 23828566 Free PMC article.
-
Twenty Years of AIRE.Front Immunol. 2018 Feb 12;9:98. doi: 10.3389/fimmu.2018.00098. eCollection 2018. Front Immunol. 2018. PMID: 29483906 Free PMC article. Review.
-
Antigen recognition by autoreactive CD4⁺ thymocytes drives homeostasis of the thymic medulla.PLoS One. 2012;7(12):e52591. doi: 10.1371/journal.pone.0052591. Epub 2012 Dec 27. PLoS One. 2012. PMID: 23300712 Free PMC article.
-
Basic interactions responsible for thymus function explain the convoluted medulla shape.Proc Natl Acad Sci U S A. 2025 Jun 24;122(25):e2415288122. doi: 10.1073/pnas.2415288122. Epub 2025 Jun 20. Proc Natl Acad Sci U S A. 2025. PMID: 40540597 Free PMC article.
-
Severe thymic atrophy in a mouse model of skin inflammation accounts for impaired TNFR1 signaling.PLoS One. 2012;7(10):e47321. doi: 10.1371/journal.pone.0047321. Epub 2012 Oct 11. PLoS One. 2012. PMID: 23071785 Free PMC article.
References
-
- von Boehmer H, Aifantis I, Gounari F, Azogui O, Haughn L, Apostolou I, Jaeckel E, Grassi F, Klein L. Thymic selection revisited: how essential is it? Immunol Rev. 2003;191:62–78. - PubMed
-
- Gallegos AM, Bevan MJ. Central tolerance: good but imperfect. Immunol Rev. 2006;209:290–296. - PubMed
-
- Thoman ML. The pattern of T lymphocyte differentiation is altered during thymic involution. Mech Ageing Dev. 1995;82:155–170. - PubMed
-
- Goya RG, Bolognani F. Homeostasis, thymic hormones and aging. Gerontology. 1999;45:174–178. - PubMed
-
- Dominguez-Gerpe L, Rey-Mendez M. Evolution of the thymus size in response to physiological and random events throughout life. Microsc Res Tech. 2003;62:464–476. - PubMed
Publication types
MeSH terms
Substances
Grants and funding
LinkOut - more resources
Full Text Sources
Other Literature Sources
Molecular Biology Databases
Research Materials
