. 2008 May 15;14(10):3185-92.
doi: 10.1158/1078-0432.CCR-08-0037.

Pretreatment with cisplatin enhances E7-specific CD8+ T-Cell-mediated antitumor immunity induced by DNA vaccination

Affiliations

Pretreatment with cisplatin enhances E7-specific CD8+ T-Cell-mediated antitumor immunity induced by DNA vaccination

Chih-Wen Tseng et al. Clin Cancer Res. .

Abstract

Purpose: Because the combination of multiple modalities for cancer treatment is more likely to generate more potent therapeutic effects for the control of cancer, we have explored the combination of chemotherapy using cisplatin, which is routinely used in chemotherapy for advanced cervical cancer, with immunotherapy using DNA vaccines encoding calreticulin (CRT) linked to human papillomavirus type 16 E7 antigen (CRT/E7) in a preclinical model.

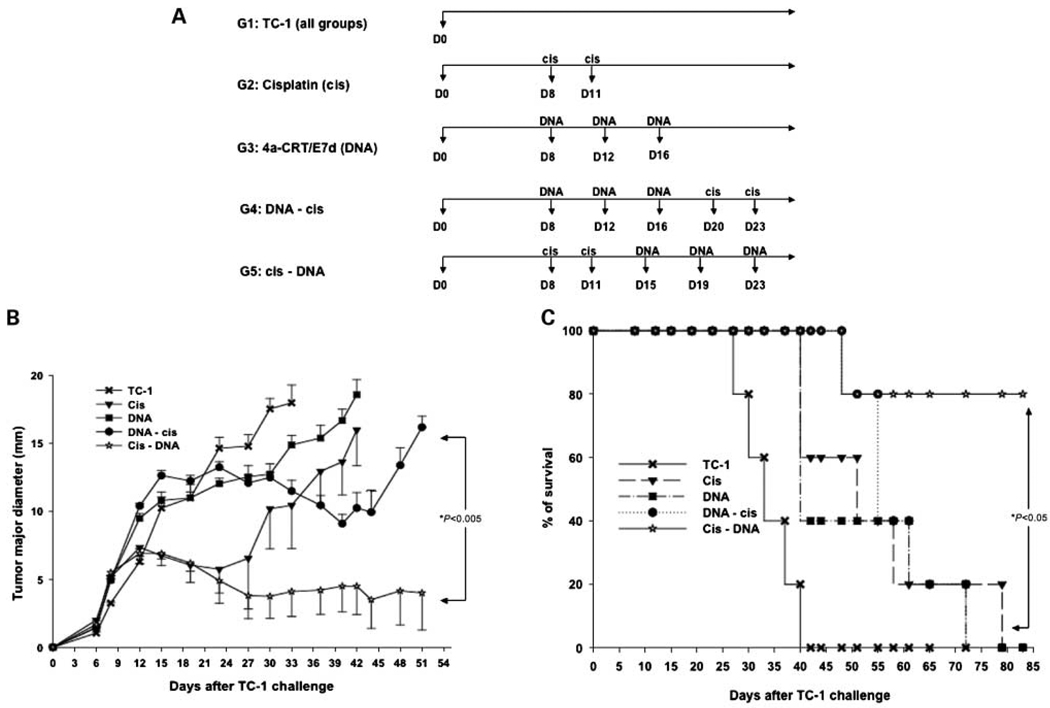
Experimental design: We characterized the combination of cisplatin with CRT/E7 DNA vaccine using different regimen for its potential ability to generate E7-specific CD8+ T-cell immune responses as well as antitumor effects against E7-expressing tumors.

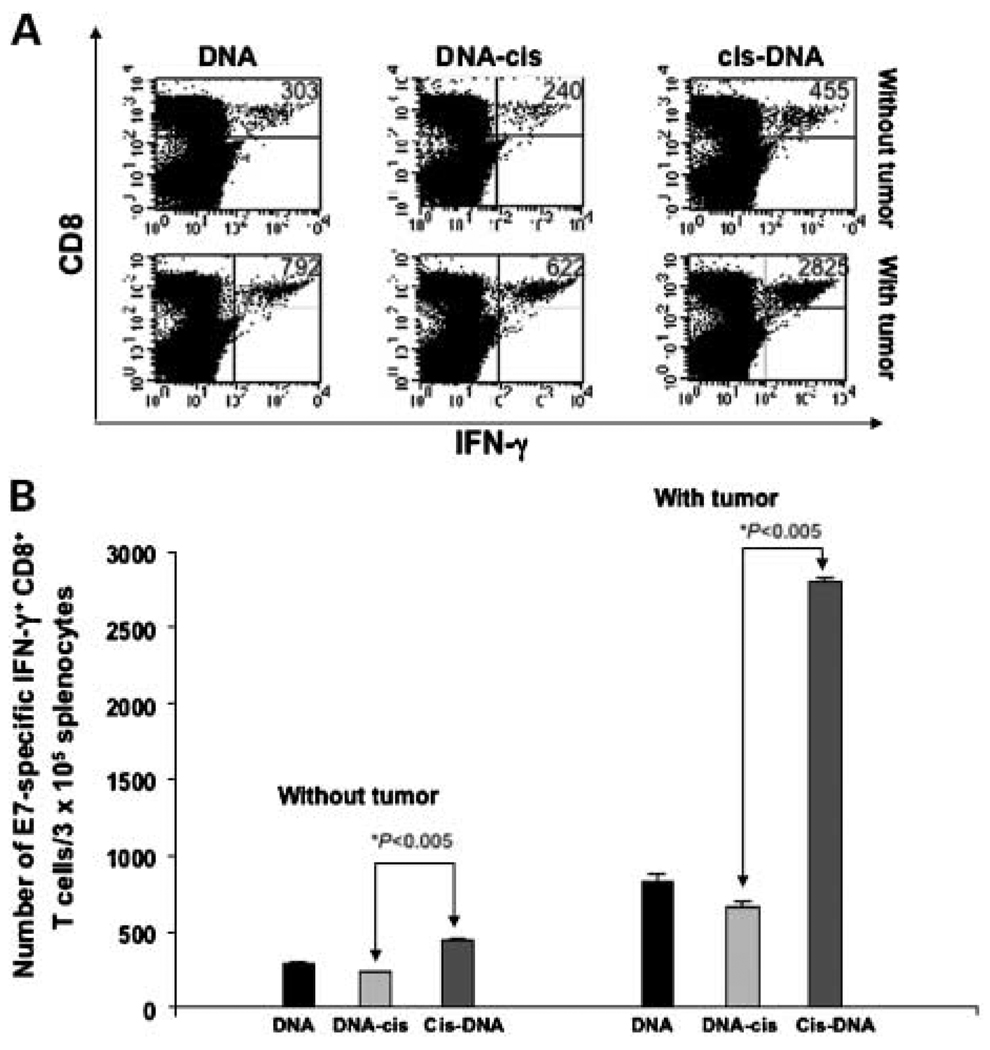
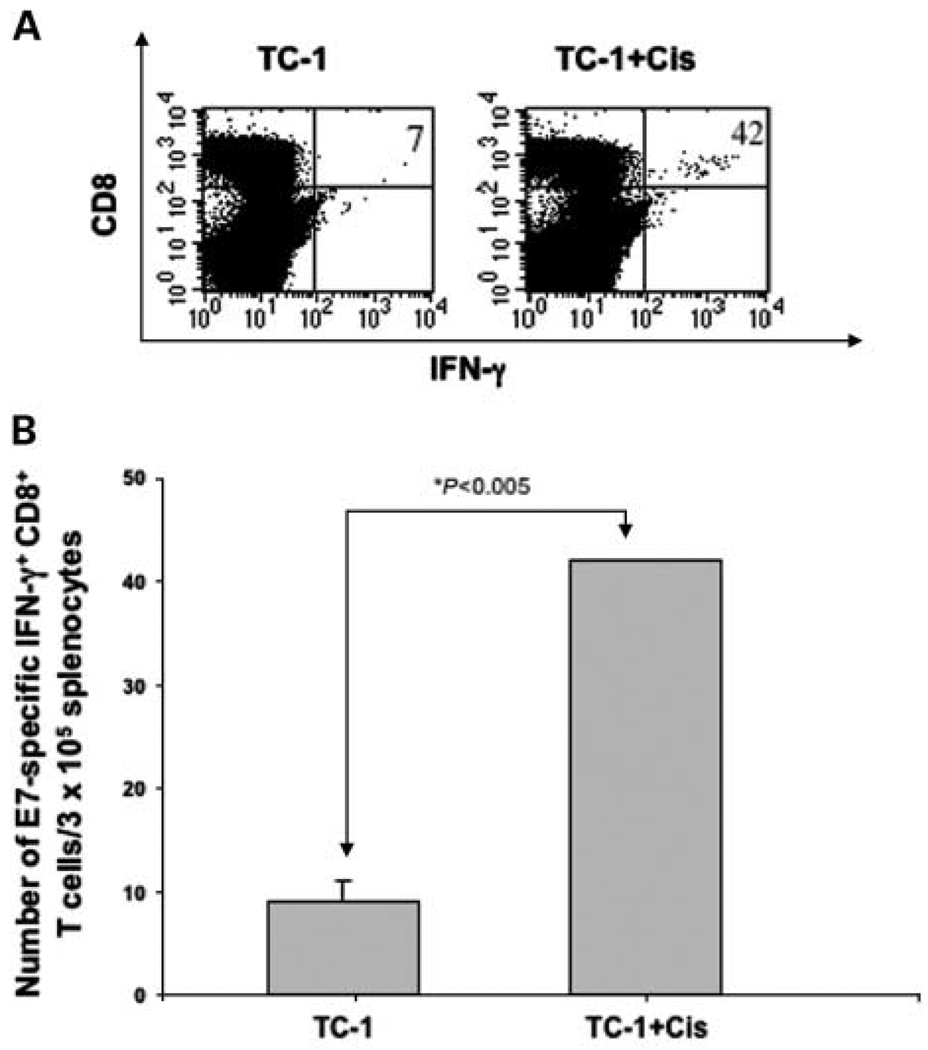
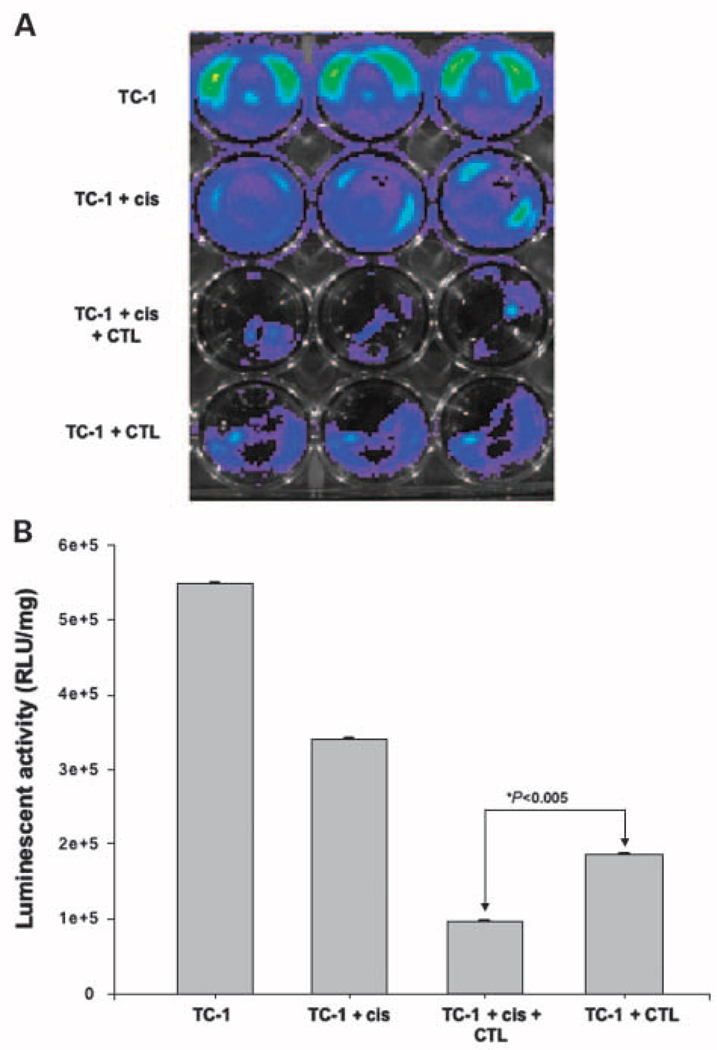
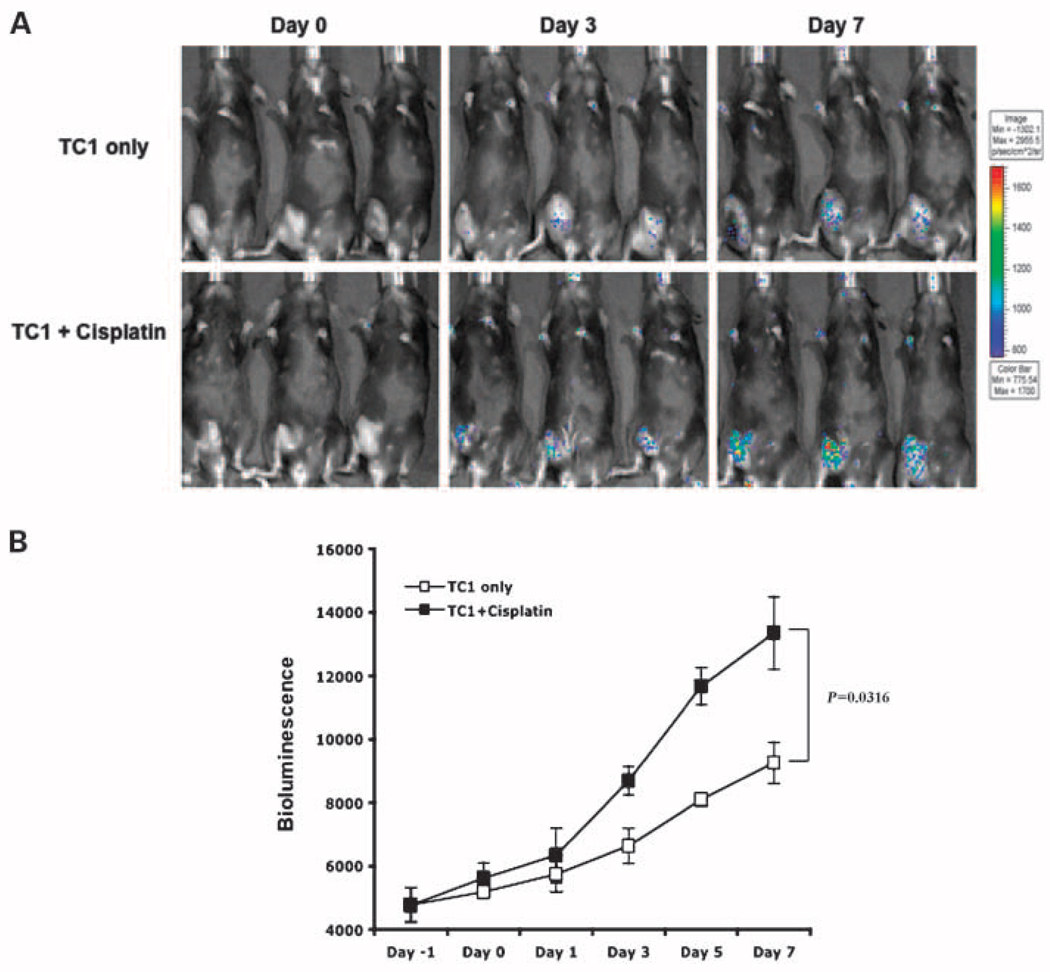
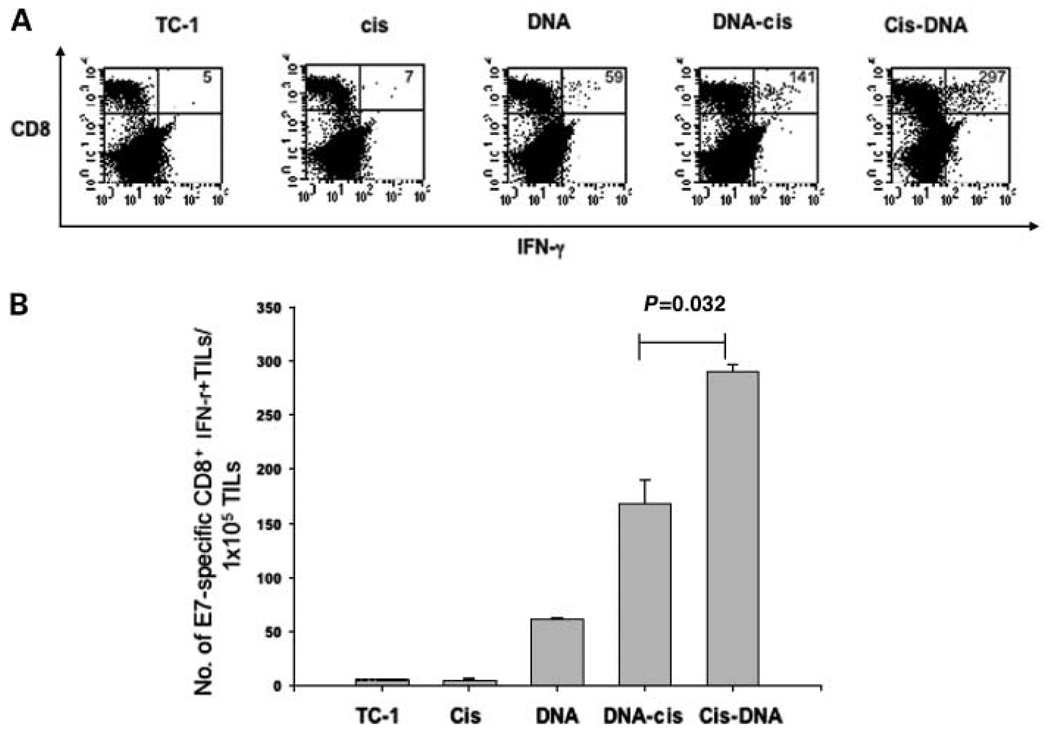
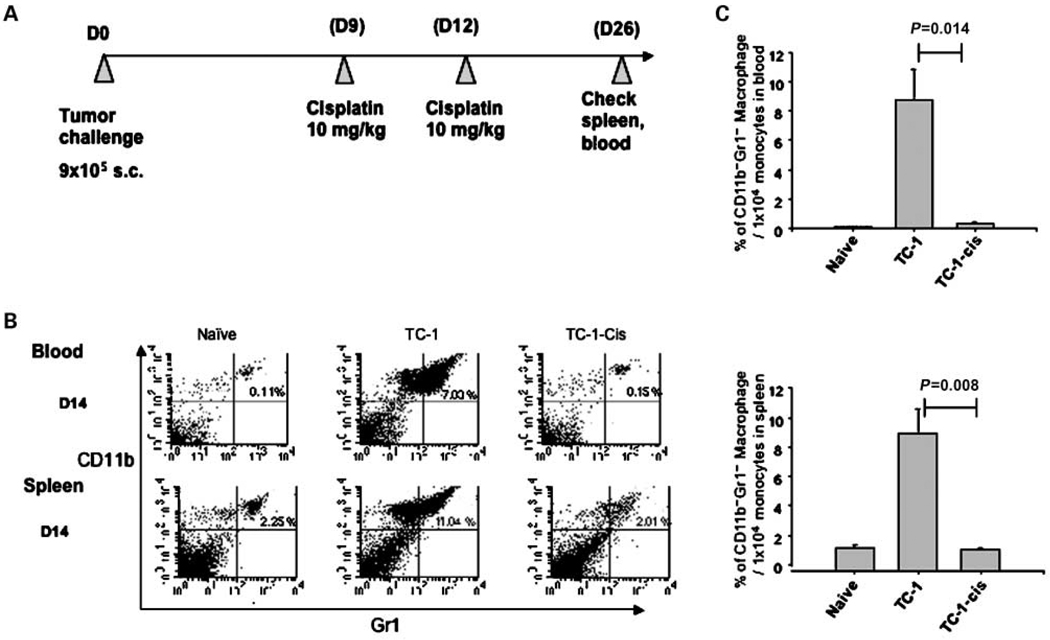
Results: Our results indicate that treatment of tumor-bearing mice with chemoimmunotherapy combining cisplatin followed by CRT/E7 DNA generated the highest E7-specific CD8+ T-cell immune response and produced the greatest antitumor effects and long-term survival as well as significant levels of E7-specific tumor-infiltrating lymphocytes compared with all the other treatment regimens. Furthermore, we found that treatment with cisplatin leads to the cell-mediated lysis of E7-expressing tumor cells in vitro and increased number of E7-specific CD8+ T-cell precursors in tumor-bearing mice. In addition, we observed that E7-specific CD8+ T cells migrate to and proliferate in the location of TC-1 tumors in mice treated with cisplatin.

Conclusions: Thus, our data suggest that chemoimmunotherapy using cisplatin followed by CRT/E7 DNA vaccine is an effective treatment against E7-expressing tumors and may potentially be translated into the clinical arena.


Conflict of interest statement

Disclosure of Potential Conflicts of Interest

No potential conflicts of interest were disclosed.

Figures

Fig. 1
Fig. 1
In vivo tumor treatment experiments. Groups of C57BL/6 mice (five per group) were s.c. challenged with 1 × 10⁵ per mouse of TC-1 tumor cells on day 0. Tumor-bearing mice were treated with cisplatin (cis) and/or DNA-encoding CRT/E7 (DNA) as indicated in the time line. Cisplatin was given via i.p. injection of 10 mg/kg body weight. DNA was given via gene gun in the amount of 2 µg/mouse. A, diagrammatic representation of the different treatment regimens of cisplatin and/or DNA vaccine. B, line graph depicting the tumor volume in TC-1 tumor-bearing mice treated with the different treatment regimens. Points, mean; bars, SE. Note that the group of tumor-bearing mice treated with cisplatin followed by the DNA vaccine had the best therapeutic antitumor effect over time compared with tumor-bearing mice treated with the other treatment regimens (P < 0.005). C, Kaplan-Meier survival analysis of TC-1 tumor-bearing mice treated with the different treatment regimens. Note that the tumor-bearing mice treated with cisplatin followed by DNA vaccine showed improved survival compared with tumor-bearing mice treated with the other treatment regimens (P < 0.05).
Fig. 2
Fig. 2
Intracellular cytokine staining followed by flow cytometry analysis to determine the number of E7-specific CD8+ T cells in tumor-bearing mice treated with cisplatin and/or DNA vaccine. Groups of C57BL/6 mice (five per group) were challenged with TC-1 tumor cells and treated with cisplatin and/or DNA as illustrated in Fig. 1A. Naive C57BL/6 mice (five per group) were also given cisplatin and/or DNA following the same regimen as tumor-bearing mice for comparison. Thirty days after tumor challenge, splenocytes from mice with and without tumor challenge were harvested and incubated with E7 peptide overnight. Determination of the E7-specific CD8+ T cells was done by intracellular IFN-γ staining followed by flow cytometry analysis. A, top right quadrant, representative data of intracellular cytokine stain followed by flow cytometry analysis showing the number of E7-specific IFN-γ+ CD8+ T cells in the various groups. B, bar graph depicting the numbers of E7-specific IFN-γ– producing CD8+ T cells per 3 × 10⁵ pooled splenocytes. Columns, mean; bars, SE.
Fig. 3
Fig. 3
Intracellular cytokine staining followed by flow cytometry analysis to determine the number of E7-specific CD8+ T cells in tumor-bearing mice treated with or without cisplatin. Groups of C57BL/6 mice (five per group) were challenged with TC-1 tumor cells and treated with or without cisplatin at the dose of 10 mg/kg body weight twice with a 3-d interval. Thirty days after tumor challenge, splenocytes from nontreated and treated mice were harvested and incubated with E7 peptide overnight. Determination of the E7-specific CD8+ T cells was done by intracellular IFN-γ staining followed by flow cytometry analysis. A, representative data of intracellular cytokine stain followed by flow cytometry analysis showing the number of E7-specific IFN-γ+ CD8+ T cells in the different groups. B, bar graph depicting the numbers of E7-specific IFN-γ– producing CD8+ T cells per 3 × 10⁵ pooled splenocytes. Columns, mean; bars, SE. Note that the TC-1 tumor-bearing mice treated with cisplatin showed significantly increased levels of E7-specific CD8+ T cells (P < 0.005).
Fig. 4
Fig. 4
In vitro cytotoxicity assay. Luciferase-expressing TC-1 tumor cells were added to 24-well plates at a dose of 5 × 10⁴ per well. Three days later, TC-1 tumor cells were untreated, treated with 5 µg/mL cisplatin alone, treated with 5 µg/mL cisplatin and 1 × 10⁶ E7-specific CTLs, or treated with 1 × 10⁶ E7-specific CTL alone. The degree of CTL-mediated killing of the tumor cells was indicated by the decrease of luminescence activity using the IVIS Luminescence Imaging System Series 200. Bioluminescence signals were acquired for 1 min. A, representative luminescence images of 24-well plates showing lysis of the tumor cells. B, bar graph depicting the quantification of luminescence intensity in tumor cells treated with cisplatin and/or E7-specific CTLs. Columns, mean; bars, SE. Note that the TC-1 tumor cells treated with cisplatin and E7-specific CTLs led to significant loss of luminescence intensity indicating enhanced lysis of tumor cells by the E7-specific CD8+ T cells (P < 0.005). RLU, relative luciferase unit.
Fig. 5
Fig. 5
Characterization of luciferase-expressing E7-specific CD8+ T cells in TC-1 tumor-bearing mice treated with or without cisplatin using luminescence imaging. Groups of C57BL/6 mice (five per group) were challenged with 5 × 10⁵ per mouse of TC-1 tumor cells. On days 8 and 11, the mice were treated either with cisplatin at the dose of 10 mg/kg body weight or with PBS (control) by i.p. administration. One week after the last cisplatin injection, TC-1 tumor-bearing mice were i.v. given 5 × 10⁶ cells per mouse of E7-specific CD8+ T cells expressing luciferase (E7T-LUC). Mice were imaged using the IVIS Imaging System Series 200. Bioluminescence signals were acquired for 5 min on days 0, 3, and 7 after adoptive transfer treatment. A, representative luminescence images of tumor-bearing mice treated with or without cisplatin on 0, 3, and 7 d after adoptive transfer treatment of E7T-LUC cells. B, line graph depicting the kinetic expression of luciferase over a period of 7 d in the tumor-bearing mice treated with or without cisplatin. Points, mean; bars, SE.
Fig. 6
Fig. 6
Intracellular cytokine staining followed by flow cytometry analysis to determine the number of E7-specific CD8+ TILs in tumor-bearing mice treated with cisplatin and/or DNA vaccine. Groups of C57BL/6 mice (five per group) were challenged with TC-1 tumor cells and treated with cisplatin and/or DNA as illustrated in Fig. 1A. Thirty days after tumor challenge, TILs from mice were harvested and stained for CD8 and intracellular IFN-γ and then characterized for E7-specific CD8+ TILs using intracellular IFN-γ staining followed by flow cytometry analysis. A, top right quadrant, representative data of intracellular cytokine staining followed by flow cytometry analysis showing the number of E7-specific IFN-γ+ CD8+ TILs in the various groups. B, bar graph depicting the numbers of E7-specific IFN-γ– producing CD8+ TILs per 1 × 10⁵ TILs. Columns, mean; bars, SE.
Fig. 7
Fig. 7
Intracellular cytokine staining followed by flow cytometry analysis to determine the number of CD11b+Gr1+ myeloid suppressor cells in tumor-bearing mice treated with or without cisplatin. Groups of C57BL/6 mice (five per group) were challenged with 9 × 10⁵ per mouse of TC-1 tumor cells. Nine days later, the mice were treated with or without cisplatin at the dose of 10 mg/kg body weight twice with a 3-d interval. Blood samples and splenocytes were harvested on day 26 after tumor challenge. The cells isolated from blood and spleens were then characterized for CD11b+Gr1+ myeloid suppressor cells using flow cytometry analysis. A, diagrammatic representation of the treatment regimen of cisplatin. B, representative flow cytometry analysis data showing the number of CD11b+Gr1+ myeloid suppressor cells in the different groups. C, bar graph depicting the numbers of CD11b+Gr1+ myeloid suppressor cells per 1 × 10⁴ monocytes in the blood or in the spleen. Columns, mean; bars, SE.

Similar articles

Cited by

References

    1. Emens LA, Jaffee EM. Leveraging the activity of tumor vaccines with cytotoxic chemotherapy. Cancer Res. 2005;65:8059–8064. - PubMed
    1. Emens LA. Chemotherapy and tumor immunity: an unexpected collaboration. Front Biosci. 2008;13:249–257. - PMC - PubMed
    1. Donnelly JJ, Ulmer JB, Liu MA. DNA vaccines. Life Sci. 1997;60:163–172. - PubMed
    1. Gurunathan S, Klinman DM, Seder RA. DNA vaccines: immunology, application, and optimization. Annu Rev Immunol. 2000;18:927–974. - PubMed
    1. Hung CF, Wu TC. Improving DNA vaccine potency via modification of professional antigen presenting cells. Curr Opin Mol Ther. 2003;5:20–24. - PubMed

Publication types

MeSH terms