. 2008 Jun 20;102(12):1492-501.
doi: 10.1161/CIRCRESAHA.107.168070. Epub 2008 May 15.

Deficiency of adipose differentiation-related protein impairs foam cell formation and protects against atherosclerosis

Affiliations

Deficiency of adipose differentiation-related protein impairs foam cell formation and protects against atherosclerosis

Antoni Paul et al. Circ Res. .

Abstract

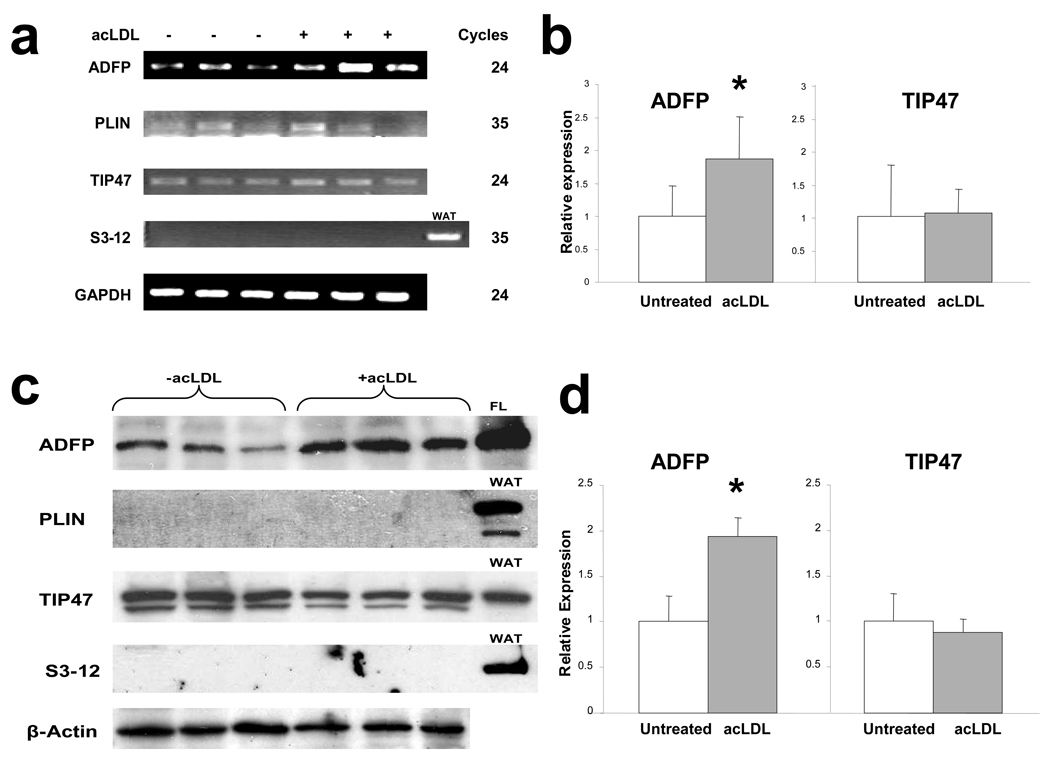
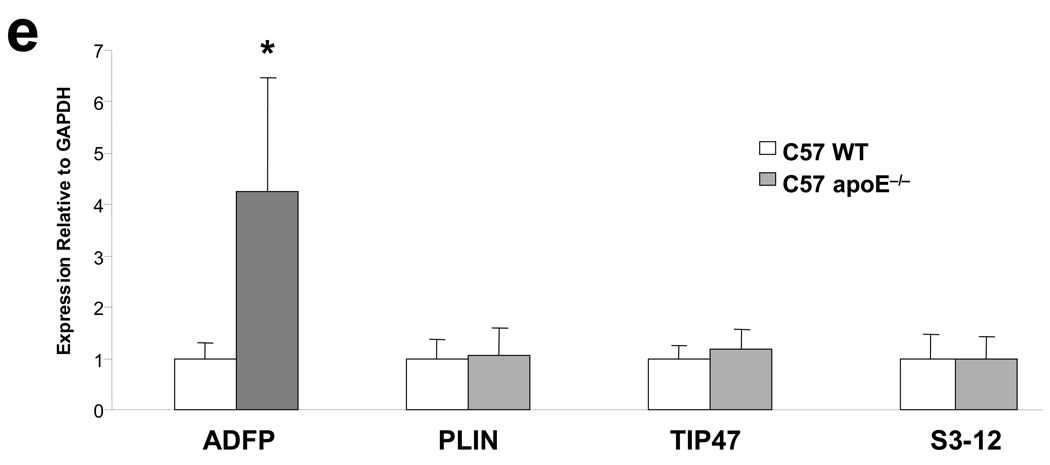
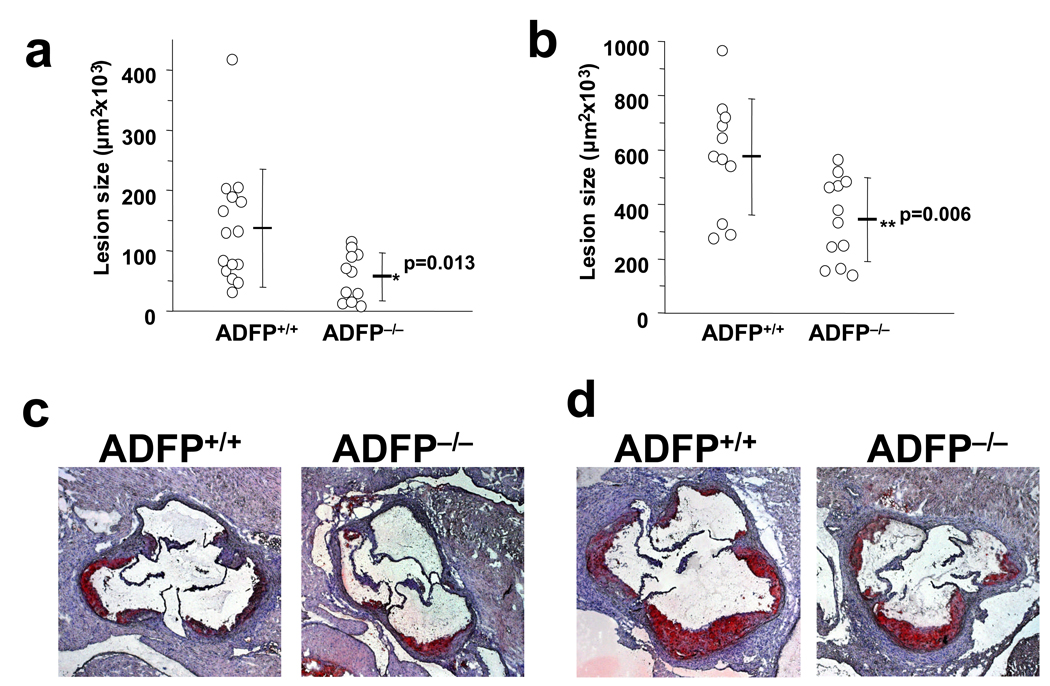
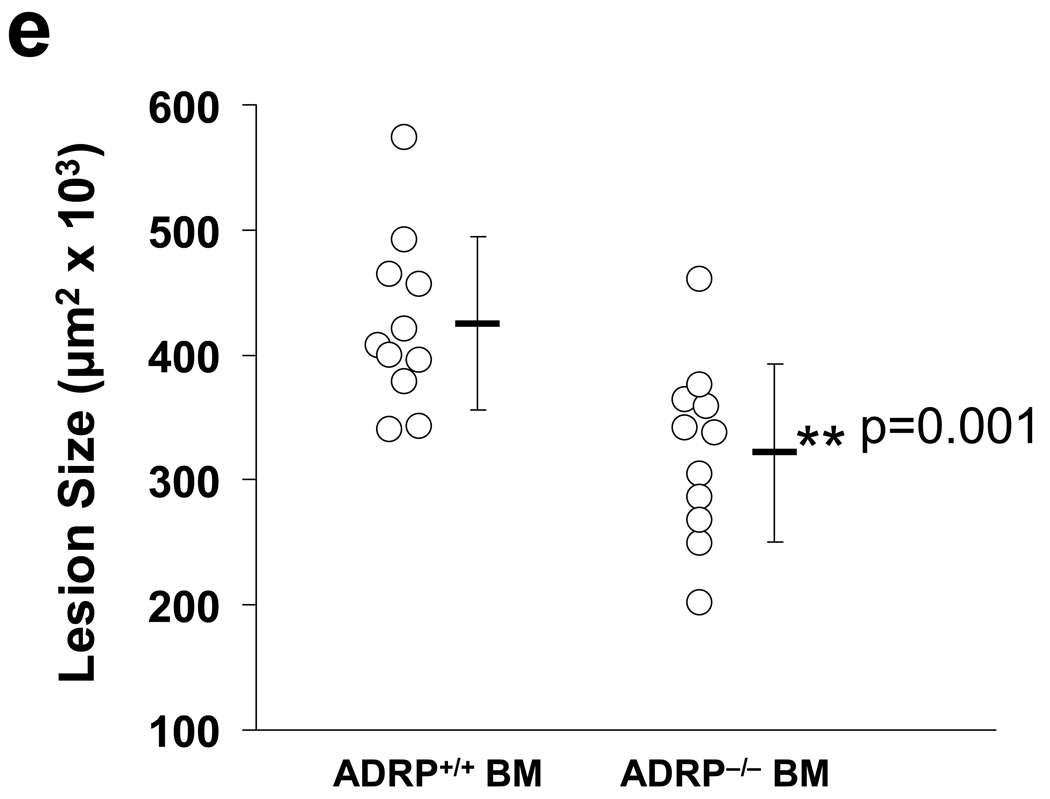
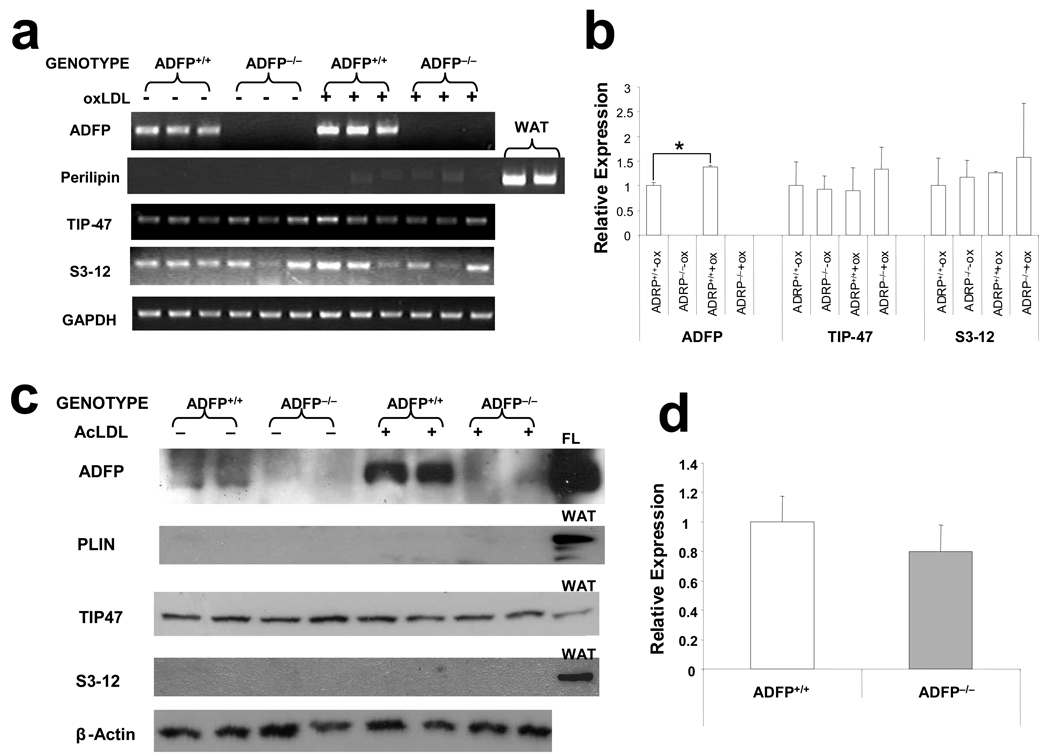
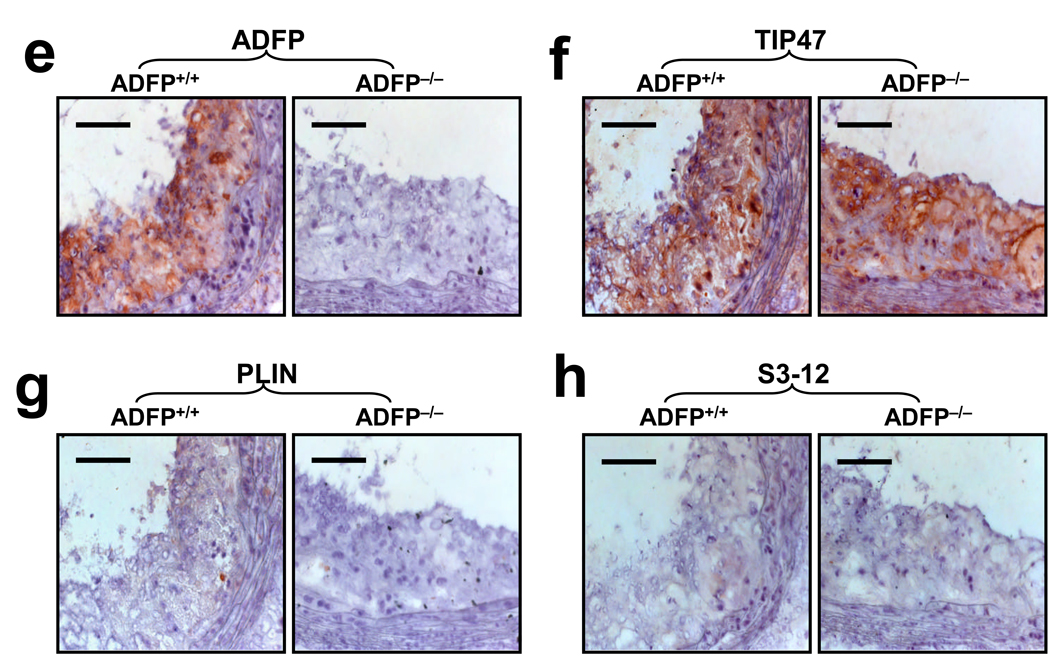
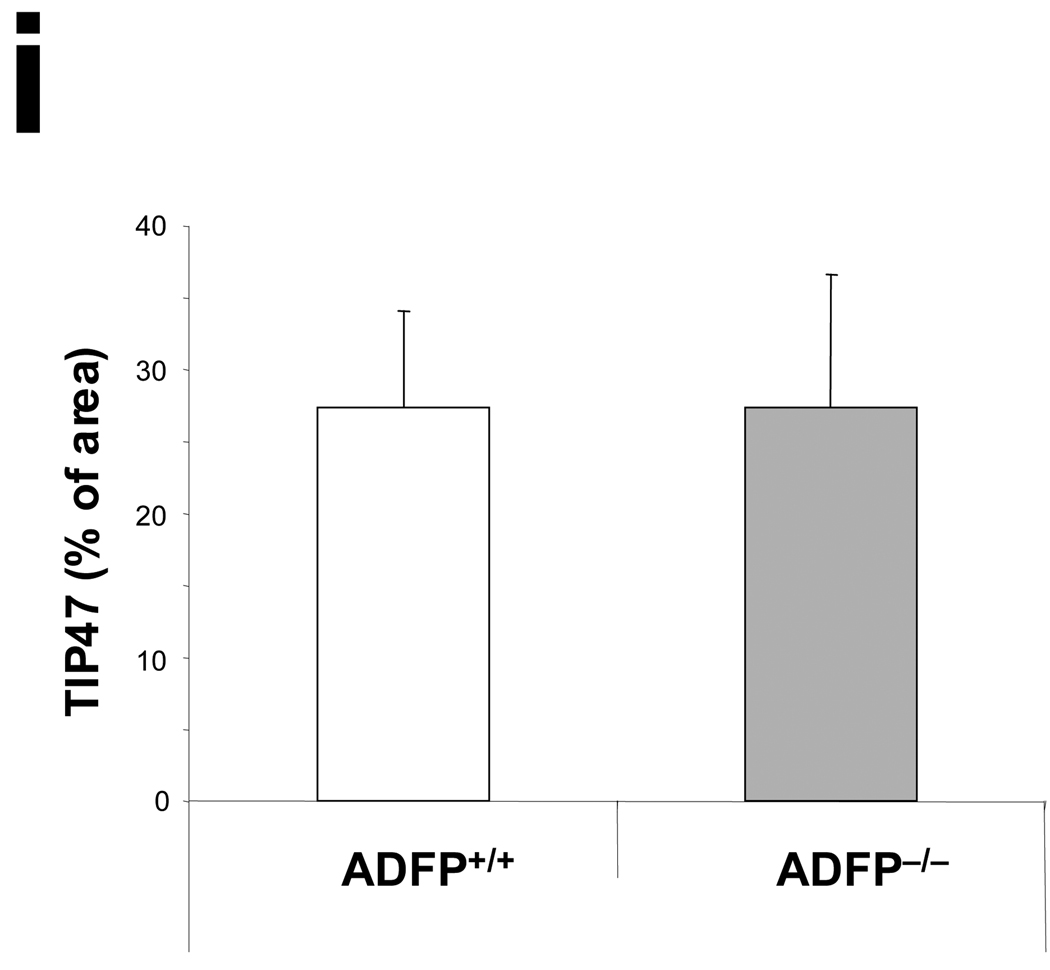
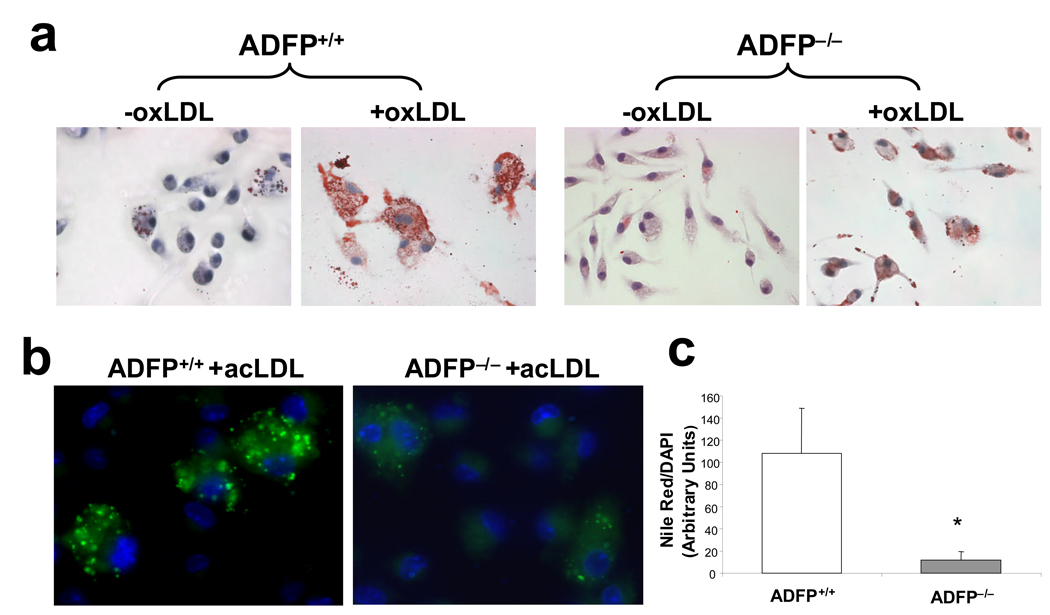
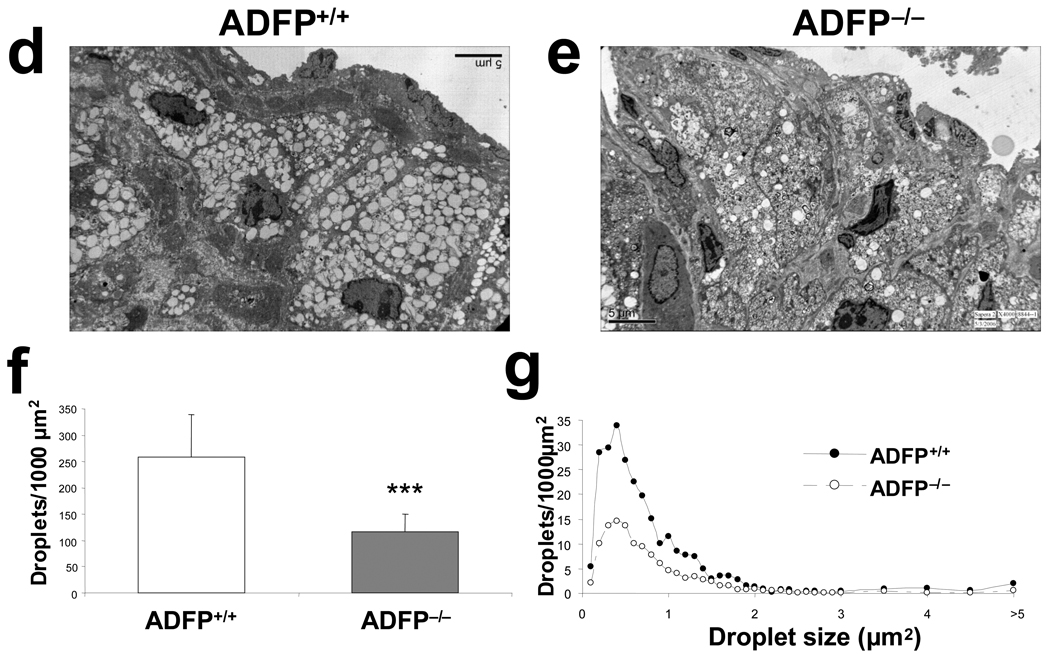
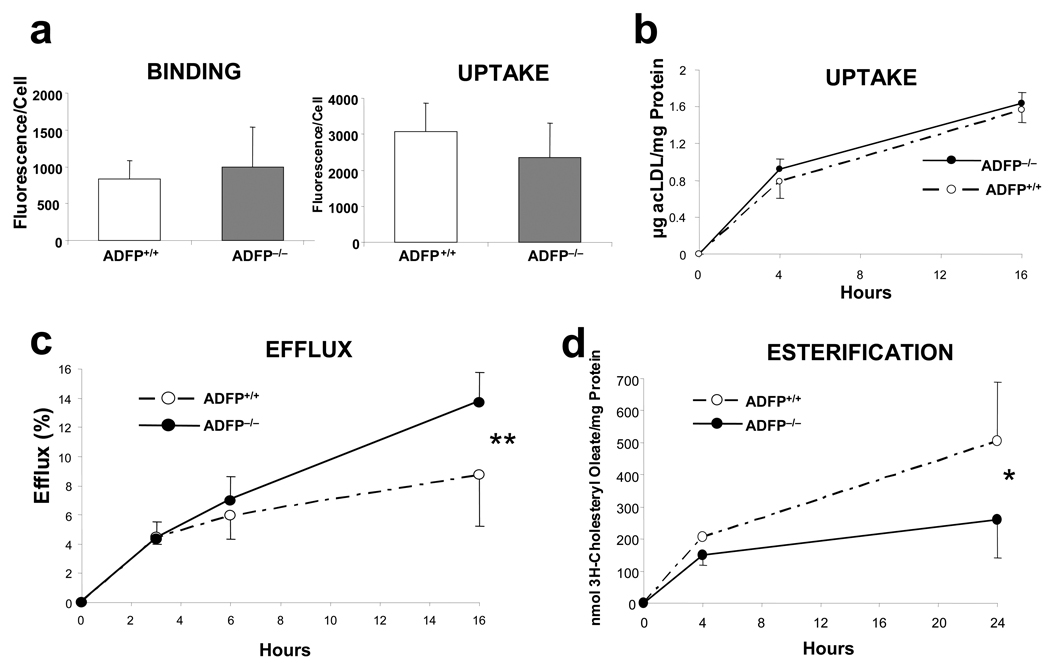
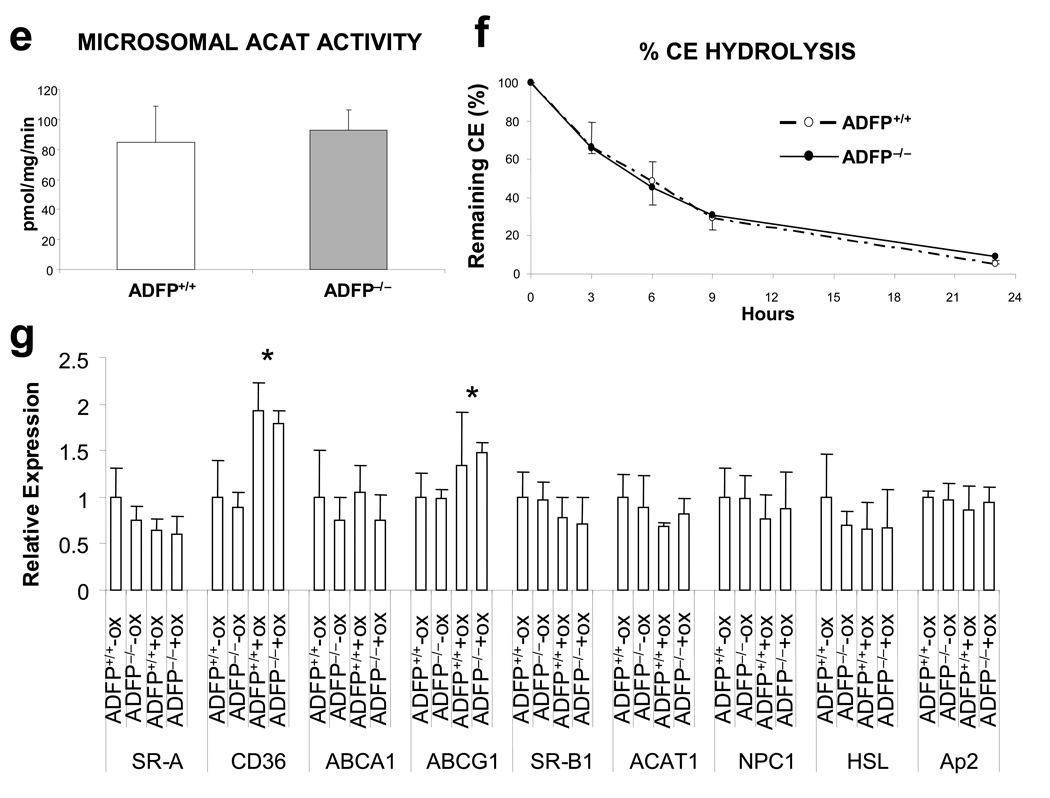
Foam cells are a hallmark of atherosclerosis. However, it is unclear whether foam cell formation per se protects against atherosclerosis or fuels it. In this study, we investigated the role of adipose differentiation-related protein (ADFP), a major lipid droplet protein (LDP), in the regulation of foam cell formation and atherosclerosis. We show that ADFP expression facilitates foam cell formation induced by modified lipoproteins in mouse macrophages in vitro. We show further that Adfp gene inactivation in apolipoprotein E-deficient (ApoE(-/-)) mice reduces the number of lipid droplets in foam cells in atherosclerotic lesions and protects the mice against atherosclerosis. Moreover, transplantation of ADFP-null bone marrow-derived cells effectively attenuated atherosclerosis in ApoE(-/-) mice. Deficiency of ADFP did not cause a detectable compensatory increase in the other PAT domain proteins in macrophages in vitro or in vivo. Mechanistically, ADFP enables the macrophage to maintain its lipid content by hindering lipid efflux. We detected no significant difference in lesion composition or in multiple parameters of inflammation in macrophages or in their phagocytic activity between mice with and without ADFP. In conclusion, Adfp inactivation in ApoE(-/-) background protects against atherosclerosis and appears to be a relatively pure model of impaired foam cell formation.


Figures

Figure 1
Figure 1
(a) Expression of PAT-domain containing proteins mRNA in RAW 264.7 macrophages cultured in the absence or in the presence of acLDL (50µg/ml) (note that ADFP and TIP47 were amplified for 24 cycles, while PLIN and S3-12 were amplified for 35 cycles). (b) qPCR analysis of expression of ADFP and TIP47 in RAW 264.7 macrophages that remained untreated or were treated with 50µg/ml of acLDL (n=6, *p<0.05). (c) Representative immunoblot and (d) integrated optical density (IOD) relative to β-actin (arbitrary units) of expression of PAT-domain containing proteins in RAW 264.7 macrophages cultured under basal conditions or with 50µg/ml of acLDL (n=3, *p<0.02). Proteins extracted from fatty liver (FL) and white adipose tissue (WAT) were loaded as positive controls. (e) qPCR analysis of expression of PAT-domain containing proteins in atherosclerosis-free aortic sinuses of C57BL/6J mice and highly atherosclerotic aortic sinuses of ApoE−/− mice (n=6, *p<0.02).
Figure 1
Figure 1
(a) Expression of PAT-domain containing proteins mRNA in RAW 264.7 macrophages cultured in the absence or in the presence of acLDL (50µg/ml) (note that ADFP and TIP47 were amplified for 24 cycles, while PLIN and S3-12 were amplified for 35 cycles). (b) qPCR analysis of expression of ADFP and TIP47 in RAW 264.7 macrophages that remained untreated or were treated with 50µg/ml of acLDL (n=6, *p<0.05). (c) Representative immunoblot and (d) integrated optical density (IOD) relative to β-actin (arbitrary units) of expression of PAT-domain containing proteins in RAW 264.7 macrophages cultured under basal conditions or with 50µg/ml of acLDL (n=3, *p<0.02). Proteins extracted from fatty liver (FL) and white adipose tissue (WAT) were loaded as positive controls. (e) qPCR analysis of expression of PAT-domain containing proteins in atherosclerosis-free aortic sinuses of C57BL/6J mice and highly atherosclerotic aortic sinuses of ApoE−/− mice (n=6, *p<0.02).
Figure 2
Figure 2
(ad) Computer-assisted morphometric measurement and representative sections of atherosclerotic lesion areas of male (a and c) and female (b and d) ApoE−/−/Adfp−/− and ApoE−/−/Adfp+/+mice. (e) Computer-assisted morphometric measurement of atherosclerotic lesion areas in mice transplanted with BM from ApoE−/−/Adfp+/+mice (ADFP+/+ BM) or ApoE−/−/Adfp−/− mice (ADFP−/− BM).
Figure 2
Figure 2
(ad) Computer-assisted morphometric measurement and representative sections of atherosclerotic lesion areas of male (a and c) and female (b and d) ApoE−/−/Adfp−/− and ApoE−/−/Adfp+/+mice. (e) Computer-assisted morphometric measurement of atherosclerotic lesion areas in mice transplanted with BM from ApoE−/−/Adfp+/+mice (ADFP+/+ BM) or ApoE−/−/Adfp−/− mice (ADFP−/− BM).
Figure 3
Figure 3
(a) RT-PCR (ADFP and TIP47 23 PCR cycles; S3-12 and PLIN 35 cycles) and (b) qPCR analysis (n= 3, *p<0.05) of the mRNA expression of the main PAT-family proteins in peritoneal macrophages isolated from ApoE−/−/Adfp−/− and ApoE−/−/Adfp+/+ mice cultured with or without 50 µg/ml of oxLDL (WAT= white adipose tissue). (c) Western blot analysis of peritoneal macrophages cultured with or without 50 µg/ml of oxLDL (FL= fatty liver). (d) qPCR analysis of TIP47 mRNA expression in aortic sinuses of ApoE−/−/Adfp−/− and ApoE−/−/Adfp+/+ mice (n=4). (e) Immunoreactive ADFP (brown color), (f) TIP47 (brown color), (g) PLIN and (h) S3-12, in atherosclerotic lesions of female ApoE−/−/Adfp+/+ (left panels) and ApoE−/−/Adfp−/− (right panels) mice. Scale bar = 50 µm. (i) Quantification of % of area positively stained for TIP47 in lesions of ApoE−/−/Adfp−/− and ApoE−/−/Adfp+/+ mice (n=7).
Figure 3
Figure 3
(a) RT-PCR (ADFP and TIP47 23 PCR cycles; S3-12 and PLIN 35 cycles) and (b) qPCR analysis (n= 3, *p<0.05) of the mRNA expression of the main PAT-family proteins in peritoneal macrophages isolated from ApoE−/−/Adfp−/− and ApoE−/−/Adfp+/+ mice cultured with or without 50 µg/ml of oxLDL (WAT= white adipose tissue). (c) Western blot analysis of peritoneal macrophages cultured with or without 50 µg/ml of oxLDL (FL= fatty liver). (d) qPCR analysis of TIP47 mRNA expression in aortic sinuses of ApoE−/−/Adfp−/− and ApoE−/−/Adfp+/+ mice (n=4). (e) Immunoreactive ADFP (brown color), (f) TIP47 (brown color), (g) PLIN and (h) S3-12, in atherosclerotic lesions of female ApoE−/−/Adfp+/+ (left panels) and ApoE−/−/Adfp−/− (right panels) mice. Scale bar = 50 µm. (i) Quantification of % of area positively stained for TIP47 in lesions of ApoE−/−/Adfp−/− and ApoE−/−/Adfp+/+ mice (n=7).
Figure 4
Figure 4
(a) Representative Oil Red O staining of peritoneal macrophages isolated from ApoE−/−/Adfp−/− and ApoE−/−/Adfp+/+ mice that remained untreated (−oxLDL) or were exposed to oxLDL (+oxLDL; 50 µg/ml for 24 h); (b) Nile Red staining (green fluorescence) and (c) computer assisted quantification of LDs in peritoneal macrophages from ApoE−/−/Adfp−/− and ApoE−/−/Adfp+/+ mice treated with acLDL (50 µg/ml) for 24 h (n=4, *p<0.02). (d and e) Representative EM pictures (4,000×) of atherosclerotic lesions of ApoE−/−/Adfp+/+ (d) and ApoE−/−/Adfp−/− (e) mice. (f) Computer-assisted quantification of the number of LDs per area of lesion (n=9, ***p<0.001). (g) Size distribution of LDs (expressed by area) in foam cells of ApoE−/−/Adfp−/− and ApoE−/−Adfp+/+ mice.
Figure 4
Figure 4
(a) Representative Oil Red O staining of peritoneal macrophages isolated from ApoE−/−/Adfp−/− and ApoE−/−/Adfp+/+ mice that remained untreated (−oxLDL) or were exposed to oxLDL (+oxLDL; 50 µg/ml for 24 h); (b) Nile Red staining (green fluorescence) and (c) computer assisted quantification of LDs in peritoneal macrophages from ApoE−/−/Adfp−/− and ApoE−/−/Adfp+/+ mice treated with acLDL (50 µg/ml) for 24 h (n=4, *p<0.02). (d and e) Representative EM pictures (4,000×) of atherosclerotic lesions of ApoE−/−/Adfp+/+ (d) and ApoE−/−/Adfp−/− (e) mice. (f) Computer-assisted quantification of the number of LDs per area of lesion (n=9, ***p<0.001). (g) Size distribution of LDs (expressed by area) in foam cells of ApoE−/−/Adfp−/− and ApoE−/−Adfp+/+ mice.
Figure 5
Figure 5
(a) DiI-acLDL binding (left) and uptake (right) in peritoneal macrophages isolated from ApoE−/−/Adfp+/+ (n=3) and ApoE−/−/Adfp−/− (n=4) mice. (b) Time course of uptake of [3H]cholesterol-labelled acLDL in peritoneal macrophages isolated from ApoE−/−/Adfp−/− and ApoE−/−/Adfp+/+ mice (n=4). (c) Time-course of cholesterol efflux to apoA-I in peritoneal macrophages from ApoE−/−/Adfp−/− and ApoE−/−/Adfp+/+ mice (n=9, **p<0.01). The efflux is expressed as % of cholesterol effluxed with respect to the total cholesterol (intracellular + extracellular). (d) Time-course of the rate of intracellular cholesterol esterification (n=5,*p<0.05). (e) ACAT activity in isolated microsomes (n=4). (f) Time course or CE hydrolysis in [3H]cholesterol-labeled macrophages in which CHOL re-esterification was blocked with the ACAT inhibitor CP 113818 (10 µM) (n=4). (g) qPCR of analysis of proteins involved in intracellular lipid homeostasis in macrophages. Note that there were no changes between cells that express or do not express Adfp (*p<0.05 of cells cultured with 50 µg/ml of oxLDL vs. untreated cells; n=3).
Figure 5
Figure 5
(a) DiI-acLDL binding (left) and uptake (right) in peritoneal macrophages isolated from ApoE−/−/Adfp+/+ (n=3) and ApoE−/−/Adfp−/− (n=4) mice. (b) Time course of uptake of [3H]cholesterol-labelled acLDL in peritoneal macrophages isolated from ApoE−/−/Adfp−/− and ApoE−/−/Adfp+/+ mice (n=4). (c) Time-course of cholesterol efflux to apoA-I in peritoneal macrophages from ApoE−/−/Adfp−/− and ApoE−/−/Adfp+/+ mice (n=9, **p<0.01). The efflux is expressed as % of cholesterol effluxed with respect to the total cholesterol (intracellular + extracellular). (d) Time-course of the rate of intracellular cholesterol esterification (n=5,*p<0.05). (e) ACAT activity in isolated microsomes (n=4). (f) Time course or CE hydrolysis in [3H]cholesterol-labeled macrophages in which CHOL re-esterification was blocked with the ACAT inhibitor CP 113818 (10 µM) (n=4). (g) qPCR of analysis of proteins involved in intracellular lipid homeostasis in macrophages. Note that there were no changes between cells that express or do not express Adfp (*p<0.05 of cells cultured with 50 µg/ml of oxLDL vs. untreated cells; n=3).

Comment in

References

    1. Poole JC, Florey HW. Changes in the endothelium of the aorta and the behavior of macrophages in experimental atheroma of rabbits. J Pathol Bacteriol. 1958;75:245–251. - PubMed
    1. Still WJ, Marriott PR. Comparative morphology of the early atherosclerotic lesion in man and cholesterol-atherosclerosis in the rabbit; An electron microscopic study. J Atheroscler Res. 1964;4:373–386. - PubMed
    1. Lusis AJ. Atherosclerosis. Nature. 2000;407:233–241. - PMC - PubMed
    1. Libby P. Inflammation in atherosclerosis. Nature. 2002;420:868–874. - PubMed
    1. Seko Y. Giant cell and Takayasu arteritis. Curr Opin Rheumatol. 2007;19:39–43. - PubMed

Publication types

MeSH terms