. 2008:2008:619832.
doi: 10.1155/2008/619832.

Blast2GO: A comprehensive suite for functional analysis in plant genomics

Affiliations

Blast2GO: A comprehensive suite for functional analysis in plant genomics

Ana Conesa et al. Int J Plant Genomics. 2008.

Abstract

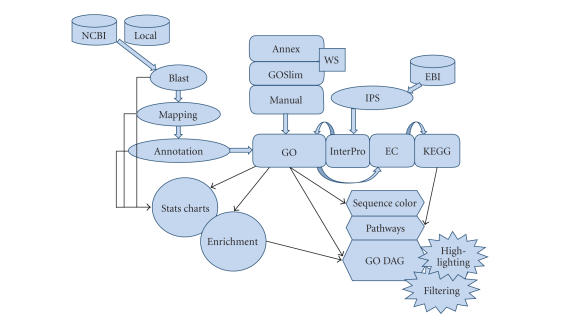
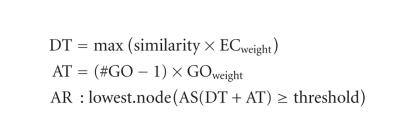
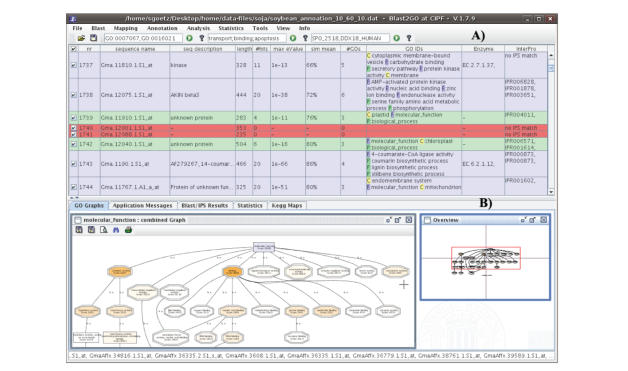
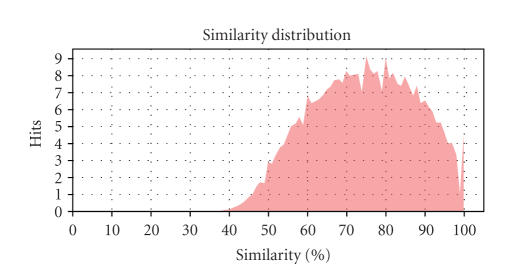
Functional annotation of novel sequence data is a primary requirement for the utilization of functional genomics approaches in plant research. In this paper, we describe the Blast2GO suite as a comprehensive bioinformatics tool for functional annotation of sequences and data mining on the resulting annotations, primarily based on the gene ontology (GO) vocabulary. Blast2GO optimizes function transfer from homologous sequences through an elaborate algorithm that considers similarity, the extension of the homology, the database of choice, the GO hierarchy, and the quality of the original annotations. The tool includes numerous functions for the visualization, management, and statistical analysis of annotation results, including gene set enrichment analysis. The application supports InterPro, enzyme codes, KEGG pathways, GO direct acyclic graphs (DAGs), and GOSlim. Blast2GO is a suitable tool for plant genomics research because of its versatility, easy installation, and friendly use.


Figures

Figure 1
Figure 1
Schematic representation of Blast2GO application. GO annotations are generated through a 3-step process: blast, mapping, annotation. InterPro terms are obtained from InterProScan at EBI, converted and merged to GOs. GO annotation can be modulated from Annex, GOSlim web services and manual editing. EC and KEGG annotations are generated from GO. Visual tools include sequence color code, KEGG pathways, and GO graphs with node highlighting and filtering options. Additional annotation data-mining tools include statistical charts and gene set enrichment analysis functions.
Figure 2
Figure 2
Blast2GO annotation rule.
Figure 3
Figure 3
Blast2GO user interface. (A) Main sequence table showing sequence color codes. (B) Graphical tab showing a combined graph with score highlighting.
Figure 4
Figure 4
Similarity distribution of Soybean GeneChip. Similarity is computed of each query-hot pair as the sum of similarity values for all matching hsps.
Figure 5
Figure 5
Species distribution chart of Soybean GeneChip after blastx to NCBI nr.
Figure 6
Figure 6
Evidence code distribution chart of Soybean GeneChip after mapping to B2G database.
Figure 7
Figure 7
Annotation process results for Soybean Affymetrix GeneChip.
Figure 8
Figure 8
GO level distribution chart for Soybean Affymetrix GeneChip. Most sequences have between 3 and 6 GO terms annotated.
Figure 9
Figure 9
InterPro merging statistics. Red column: total number of GO annotations before adding InterPro-based GO terms. Blue: total number of GO annotations after adding InterPro-based GO terms. Green: number of blast-based GO terms confirmed after InterPro merging. Yellow: too general terms removed after InterPro merging.
Figure 10
Figure 10
Molecular function combined graph of GOSlim annotation of the Soybean Affymetrix GeneChip. Nodes are colored by score value.
Figure 11
Figure 11
Bar chart for functional category enrichment analysis of Soybean membrane proteins. The Y-axis shows significantly enriched GO terms and the X-axis give the relative frequency of the term. Red bars correspond to test set (membrane) and blue bars correspond to the whole Soybean genome array.
Figure 12
Figure 12
Enriched graph (biological process) of the Soybean membrane subset of sequences. Node filter has been set at FDR < 1e-6. Nodes are colored accordingly to their FDR value in the Fisher exact's test against the whole Soybean genome array.

References

    1. Conesa A, Forment J, Gadea J, van Dijk J. Microarray technology in agricultural research. In: Falciani F, editor. Microarray Technology Through Applications. New York, NY, USA: Taylor & Francis; 2007. pp. 173–209.
    1. Nagaraj SH, Gasser RB, Ranganathan S. A hitchhiker's guide to expressed sequence tag (EST) analysis. Briefings in Bioinformatics. 2007;8(1):6–21. - PubMed
    1. Ashburner M, Ball CA, Blake JA, et al. Gene Ontology: tool for the unification of biology. The Gene Ontology Consortium. Nature Genetics. 2000;25(1):25–29. - PMC - PubMed
    1. Schomburg I, Chang A, Ebeling C, et al. BRENDA, the enzyme database: updates and major new developments. Nucleic Acids Research. 2004;32, Database issue:D431–D433. - PMC - PubMed
    1. Ogata H, Goto S, Sato K, Fujibuchi W, Bono H, Kanehisa M. KEGG: Kyoto Encyclopedia of Genes and Genomes. Nucleic Acids Research. 1999;27(1):29–34. - PMC - PubMed

LinkOut - more resources