Eye movement statistics in humans are consistent with an optimal search strategy
- PMID: 18484810
- PMCID: PMC2868380
- DOI: 10.1167/8.3.4
Eye movement statistics in humans are consistent with an optimal search strategy
Abstract
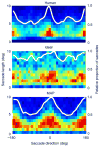
Most models of visual search are based on the intuition that humans choose fixation locations containing features that best match the features of the target. The optimal version of this feature-based strategy is what we term "maximum a posteriori (MAP) search." Alternatively, humans could choose fixations that maximize information gained about the target's location. We term this information-based strategy "ideal search." Here we compare eye movements of human, MAP, and ideal searchers in tasks where known targets are embedded at unknown locations within random backgrounds having the spectral characteristics of natural scenes. We find that both human and ideal searchers preferentially fixate locations in a donut-shaped region around the center of the circular search area, with a high density of fixations at top and bottom, while MAP searchers distribute their fixations more uniformly, with low density at top and bottom. Our results argue for a sophisticated search mechanism that maximizes the information collected across fixations.
Figures


Similar articles
-
Optimal eye movement strategies in visual search.Nature. 2005 Mar 17;434(7031):387-91. doi: 10.1038/nature03390. Nature. 2005. PMID: 15772663
-
Simple summation rule for optimal fixation selection in visual search.Vision Res. 2009 Jun;49(10):1286-94. doi: 10.1016/j.visres.2008.12.005. Epub 2009 Jan 10. Vision Res. 2009. PMID: 19138697
-
Optimal and human eye movements to clustered low value cues to increase decision rewards during search.Vision Res. 2015 Aug;113(Pt B):137-54. doi: 10.1016/j.visres.2015.05.016. Epub 2015 Jun 17. Vision Res. 2015. PMID: 26093154 Free PMC article.
-
In what ways do eye movements contribute to everyday activities?Vision Res. 2001;41(25-26):3559-65. doi: 10.1016/s0042-6989(01)00102-x. Vision Res. 2001. PMID: 11718795 Review.
-
Modeling task control of eye movements.Curr Biol. 2014 Jul 7;24(13):R622-8. doi: 10.1016/j.cub.2014.05.020. Curr Biol. 2014. PMID: 25004371 Free PMC article. Review.
Cited by
-
Expectations developed over multiple timescales facilitate visual search performance.J Vis. 2015;15(9):10. doi: 10.1167/15.9.10. J Vis. 2015. PMID: 26200891 Free PMC article.
-
From Gaussian blobs to naturalistic videos: Comparison of oculomotor behavior across different stimulus complexities.J Vis. 2020 Aug 3;20(8):26. doi: 10.1167/jov.20.8.26. J Vis. 2020. PMID: 32845961 Free PMC article.
-
Time course of target recognition in visual search.Front Hum Neurosci. 2010 Apr 13;4:31. doi: 10.3389/fnhum.2010.00031. eCollection 2010. Front Hum Neurosci. 2010. PMID: 20428512 Free PMC article.
-
Measurement of the useful field of view for single slices of different imaging modalities and targets.J Med Imaging (Bellingham). 2020 Mar;7(2):022411. doi: 10.1117/1.JMI.7.2.022411. Epub 2020 Feb 8. J Med Imaging (Bellingham). 2020. PMID: 32064303 Free PMC article.
-
Efficient saccade planning requires time and clear choices.Vision Res. 2015 Aug;113(Pt B):125-36. doi: 10.1016/j.visres.2015.05.006. Epub 2015 May 30. Vision Res. 2015. PMID: 26037735 Free PMC article.
References
-
- Aivar MP, Hayhoe MM, Chizk CL, Mruczek RE. Spatial memory and saccadic targeting in a natural task. Journal of Vision. 2005. pp. 177–193. 3. http://journalofvision.org/5/3/3/ - DOI - PubMed
-
- Burgess AE, Ghandeharian H. Visual signal detection. II. Signal-location identification. Journal of the Optical Society of America A, Optics and Image Science. 1984;1:906–910. - PubMed
-
- Carr JC, Fright WR, Beatson RK. Surface interpolation with radial basis functions for medical imaging. IEEE Transactions on Medical Imaging. 1997;16:96–107. - PubMed
-
- Carrasco M, Evert DL, Chang I, Katz SM. The eccentricity effect: Target eccentricity affects performance on conjunction searches. Perception & Psychophysics. 1995;57:1241–1261. - PubMed
-
- Carrasco M, Frieder KS. Cortical magnification neutralizes the eccentricity effect in visual search. Vision Research. 1997;37:63–82. - PubMed
Publication types
MeSH terms
Grants and funding
LinkOut - more resources
Full Text Sources
Other Literature Sources

