

The effect of senescence on orientation discrimination and mechanism tuning
- PMID: 18484811
- PMCID: PMC2584154
- DOI: 10.1167/8.3.5
The effect of senescence on orientation discrimination and mechanism tuning
Abstract
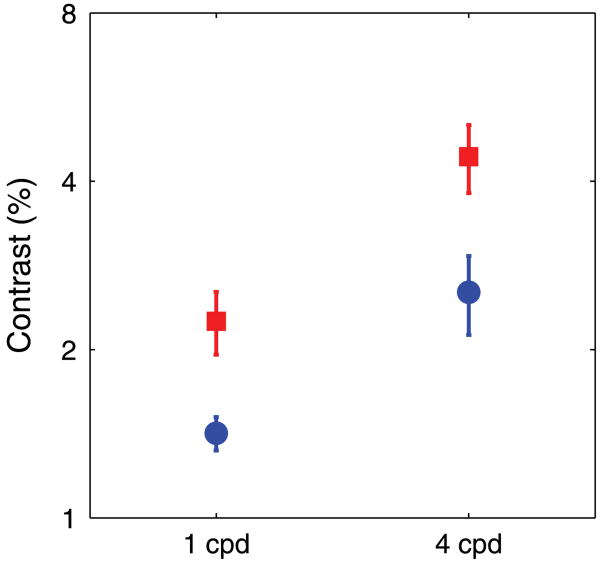
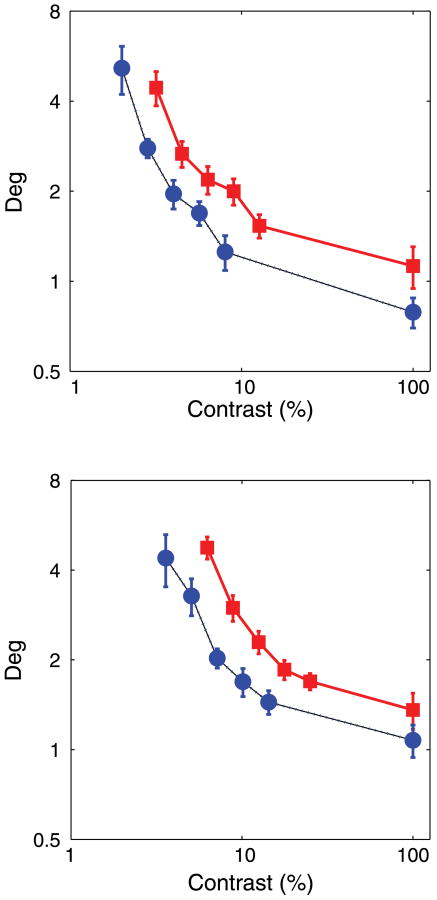
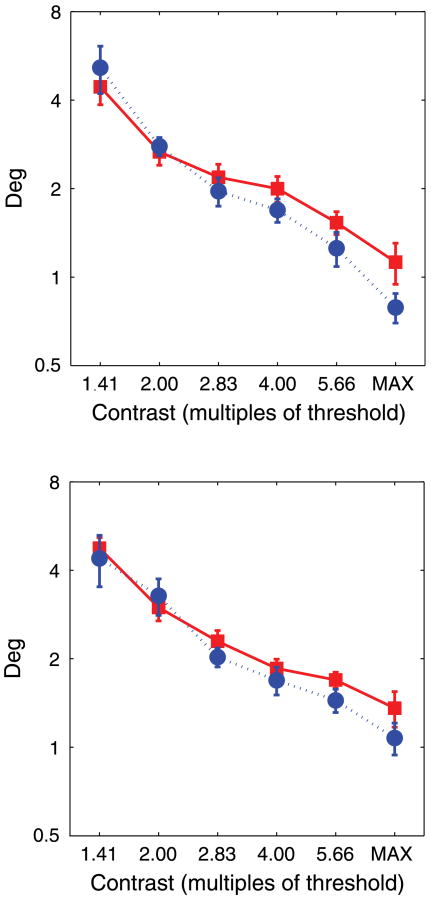
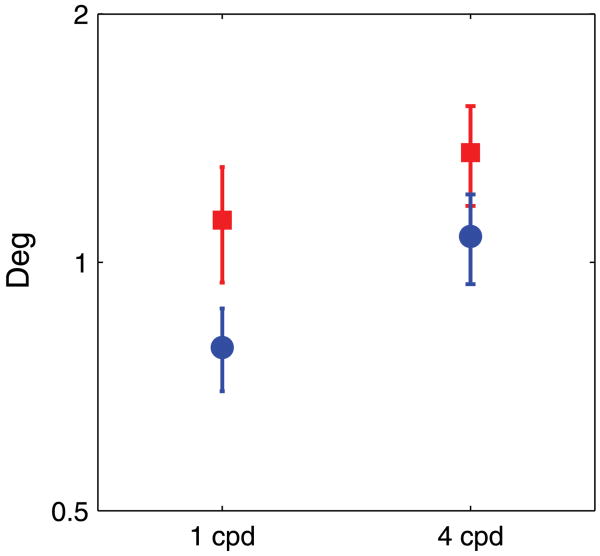
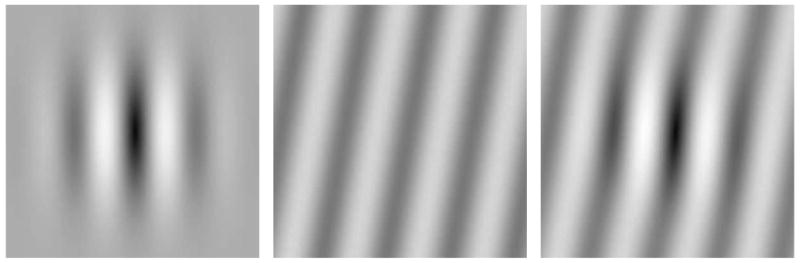
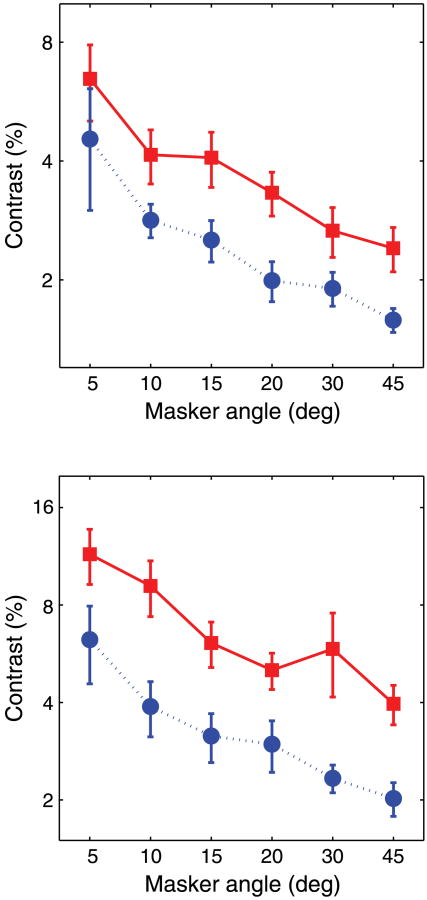
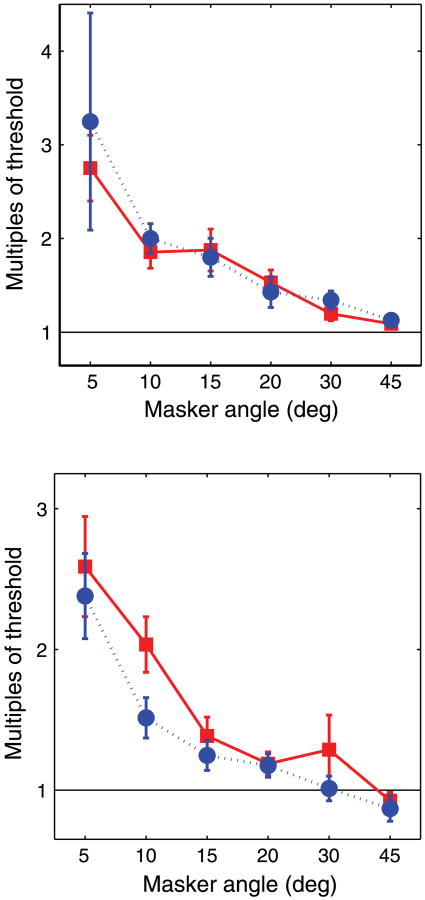
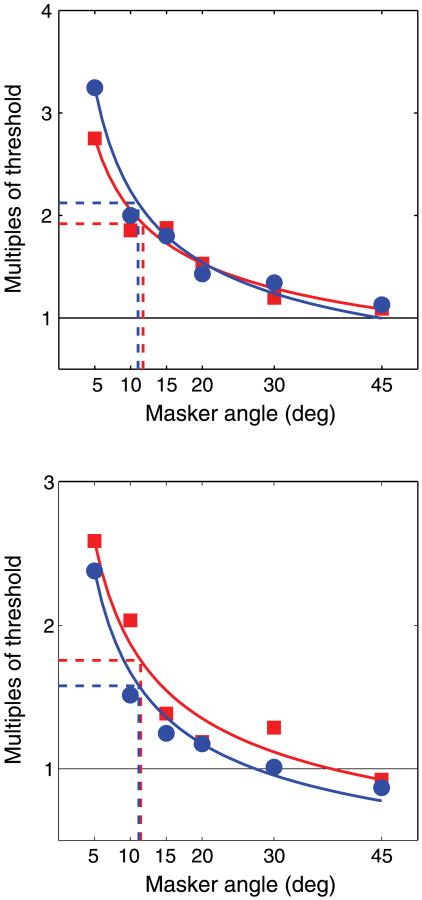
Accurately processing orientation information is a fundamental component of visual performance. Single-unit recordings have shown that the orientation tuning of individual neurons in macaque cortical areas V1 and V2 is reduced dramatically with age (M. T. Schmolesky, Y. Wang, M. Pu, & A. G. Leventhal, 2000; S. Yu, Y. Wang, X. Li, Y. Zhou, & A. G. Leventhal, 2006). These researchers suggest that losses in single-unit orientation selectivity result in declines in orientation discrimination and object recognition in older humans. Three experiments were conducted to determine whether human performance is affected by putative age-related changes in tuning of cortical neurons. Ten younger and ten older observers participated in this study. Experiment 1 demonstrated significant differences in the contrast sensitivity of the two age groups. Experiment 2 showed significant differences in orientation discrimination thresholds. However, when thresholds were plotted in terms of multiples of detection threshold, age-related differences were not observed. In Experiment 3, perceptual orientation tuning curves did not significantly differ in shape for younger and older subjects. As in Experiment 2, at any given contrast, there is a large difference in sensitivity between younger and older adults. This implies a model of orientation processing that allows the adult visual system to maintain consistent and reliable orientation information at the network and ultimately the perceptual level.
Figures
Similar articles
-
The effects of aging on orientation discrimination.Vision Res. 2007 Jun;47(13):1769-80. doi: 10.1016/j.visres.2007.02.016. Epub 2007 Apr 26. Vision Res. 2007. PMID: 17466355
-
The effect of aging on the orientational selectivity of the human visual system.Vision Res. 2009 Jan;49(1):164-72. doi: 10.1016/j.visres.2008.10.004. Epub 2008 Nov 22. Vision Res. 2009. PMID: 18977381 Clinical Trial.
-
Normalization models applied to orientation masking in the human infant.J Neurosci. 2001 Jun 15;21(12):4530-41. doi: 10.1523/JNEUROSCI.21-12-04530.2001. J Neurosci. 2001. PMID: 11404441 Free PMC article. Clinical Trial.
-
Background changes delay the perceptual availability of form information.J Neurophysiol. 2005 Dec;94(6):4331-43. doi: 10.1152/jn.01312.2004. Epub 2005 Aug 17. J Neurophysiol. 2005. PMID: 16107521
-
The Effect of Aging and Attention on Visual Crowding and Surround Suppression of Perceived Contrast Threshold.Invest Ophthalmol Vis Sci. 2017 Feb 1;58(2):860-867. doi: 10.1167/iovs.16-20632. Invest Ophthalmol Vis Sci. 2017. PMID: 28159973
Cited by
-
Occipital GABA levels in older adults and their relationship to visual perceptual suppression.Sci Rep. 2017 Oct 27;7(1):14231. doi: 10.1038/s41598-017-14577-5. Sci Rep. 2017. PMID: 29079815 Free PMC article.
-
Selective age-related changes in orientation perception.J Vis. 2020 Dec 2;20(13):13. doi: 10.1167/jov.20.13.13. J Vis. 2020. PMID: 33351062 Free PMC article.
-
Senescent changes in photopic spatial summation.J Vis. 2011 Sep 22;11(10):10.1167/11.10.15 15. doi: 10.1167/11.10.15. J Vis. 2011. PMID: 21940763 Free PMC article.
-
Effects of texture component orientation on orientation flow visibility for 3-D shape perception.PLoS One. 2013;8(1):e53556. doi: 10.1371/journal.pone.0053556. Epub 2013 Jan 3. PLoS One. 2013. PMID: 23301085 Free PMC article.
-
Multisensory Integration Strategy for Modality-Specific Loss of Inhibition Control in Older Adults.Int J Environ Res Public Health. 2018 Apr 11;15(4):718. doi: 10.3390/ijerph15040718. Int J Environ Res Public Health. 2018. PMID: 29641462 Free PMC article.
References
-
- Beard BL, Yager D, Neufeld S. Contrast detection and discrimination in young and older adults. Optometry and Vision Science. 1994;71:783–791. - PubMed
-
- Betts LR, Sekuler AB, Bennett PJ. The effects of aging on orientation discrimination. Vision Research. 2007;47:1769–1780. - PubMed
-
- Brainard DH. The Psychophysics Toolbox. Spatial Vision. 1997;10:433–436. - PubMed
-
- Brainard DH, Pelli DG, Robson T. Display characterization. In: Hornak JP, editor. Encyclopedia of imaging science and technology. New York: Wiley; 2002. pp. 72–188.
-
- Burton KB, Owsley C, Sloane ME. Aging and neural spatial contrast sensitivity: Photopic vision. Vision Research. 2004;33:939–946. - PubMed
Publication types
MeSH terms
Grants and funding
LinkOut - more resources
Full Text Sources
Medical
Research Materials
