Comparative Study
. 2008 Mar 28;8(3):33.1-30.
doi: 10.1167/8.3.33.

Vergence-accommodation conflicts hinder visual performance and cause visual fatigue

Affiliations
Comparative Study

Vergence-accommodation conflicts hinder visual performance and cause visual fatigue

David M Hoffman et al. J Vis. .

Abstract

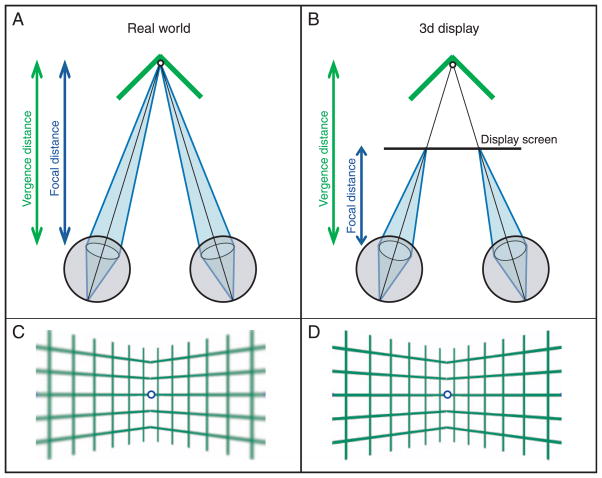
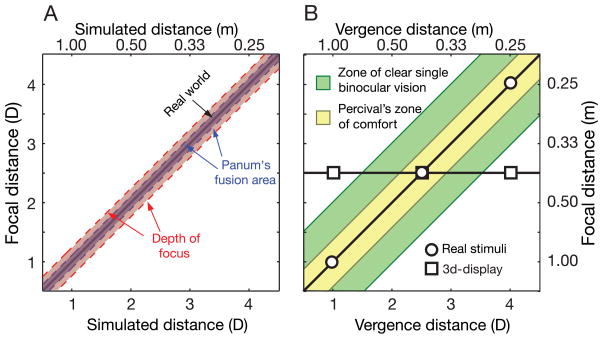
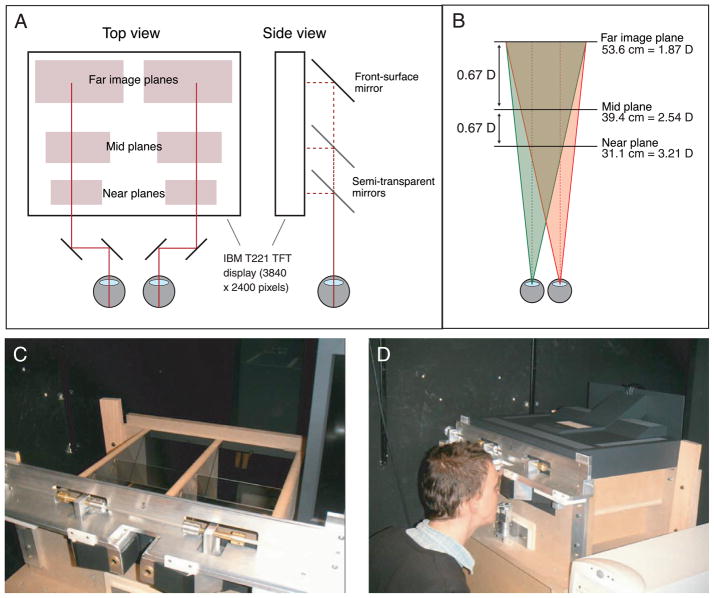
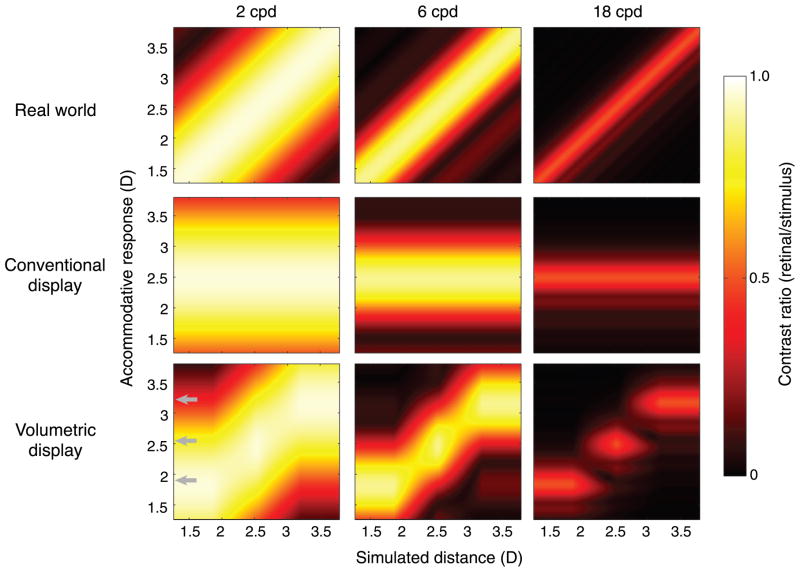
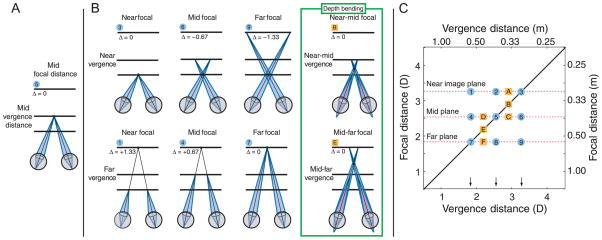
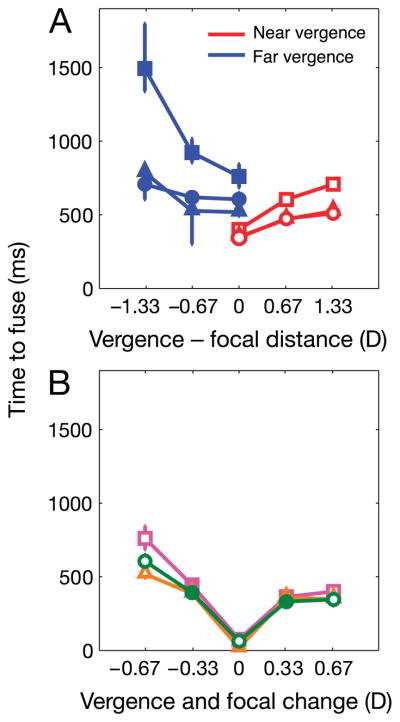
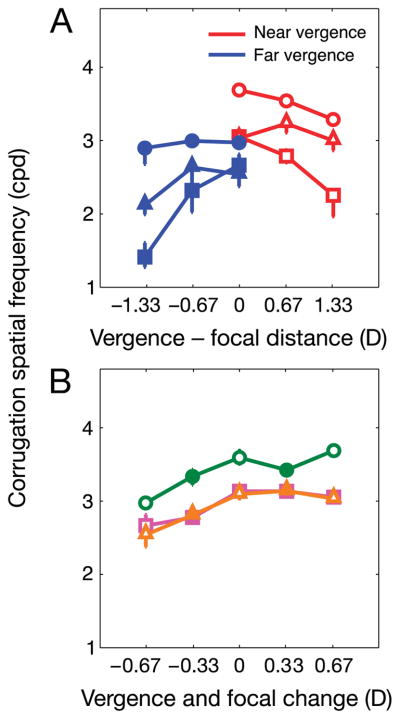
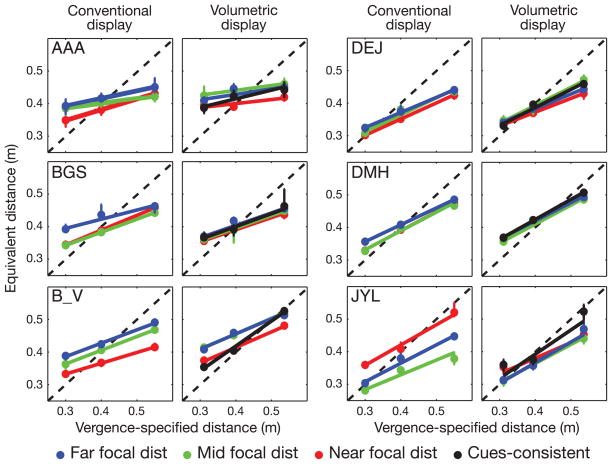
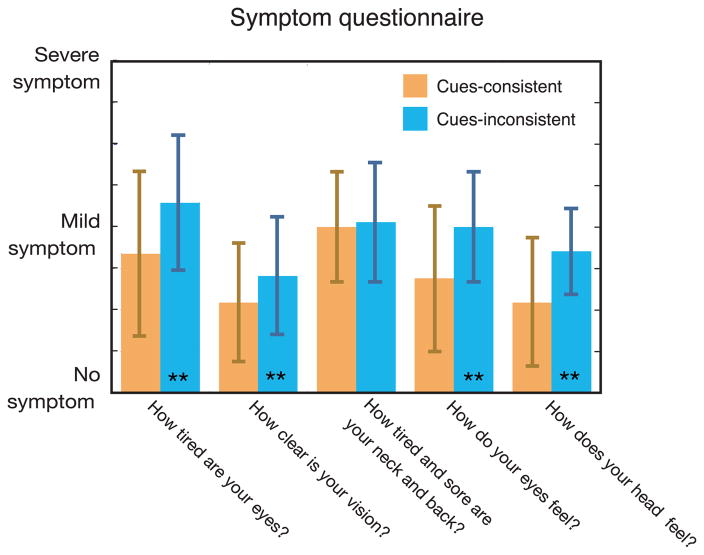
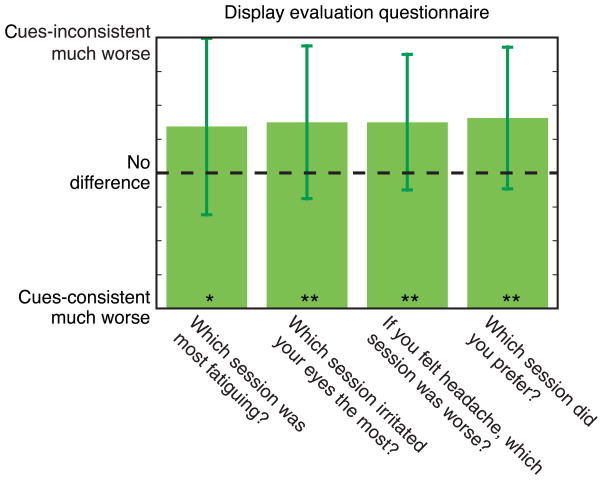
Three-dimensional (3D) displays have become important for many applications including vision research, operation of remote devices, medical imaging, surgical training, scientific visualization, virtual prototyping, and more. In many of these applications, it is important for the graphic image to create a faithful impression of the 3D structure of the portrayed object or scene. Unfortunately, 3D displays often yield distortions in perceived 3D structure compared with the percepts of the real scenes the displays depict. A likely cause of such distortions is the fact that computer displays present images on one surface. Thus, focus cues-accommodation and blur in the retinal image-specify the depth of the display rather than the depths in the depicted scene. Additionally, the uncoupling of vergence and accommodation required by 3D displays frequently reduces one's ability to fuse the binocular stimulus and causes discomfort and fatigue for the viewer. We have developed a novel 3D display that presents focus cues that are correct or nearly correct for the depicted scene. We used this display to evaluate the influence of focus cues on perceptual distortions, fusion failures, and fatigue. We show that when focus cues are correct or nearly correct, (1) the time required to identify a stereoscopic stimulus is reduced, (2) stereoacuity in a time-limited task is increased, (3) distortions in perceived depth are reduced, and (4) viewer fatigue and discomfort are reduced. We discuss the implications of this work for vision research and the design and use of displays.


Figures

Figure 1
Figure 1
Vergence and focal distance with real stimuli and stimuli presented on conventional 3D displays. (A) The viewer is fixated and focused on the vertex of a hinge. Vergence distance is the distance to the vertex. Vergence response is the distance to the intersection of the eyes’ lines of sight. Focal distance is the distance to which the eye would have to focus to create a sharply focused image. Accommodative response is the distance to which the eye is accommodated. (B) The viewer is fixated on the simulated hinge vertex on a computer display screen. Vergence distance is the same as in panel A. Focal distance is now the distance to the display. (C) The appearance of the stimulus when the viewer is accommodated to the vertex of a real hinge. In the retinal image, the joined planes (the sides) of the hinge are blurred relative to the vertex. (D) Appearance when the viewer is accommodated to the vertex of a simulated hinge. The sides and the vertex are equally sharp in the retinal image.
Figure 2
Figure 2
Consequences of vergence–accommodation coupling. The panels plot focal distance as a function of simulated (or vergence) distance. The bottom abscissa and the left ordinate have units of diopters. The top abscissa and the right ordinate have the corresponding values in meters. (A) Depth of focus and Panum’s fusion area in diopters. Here we simulate real objects, so the vergence and the focal distances specified by the object are equal to one another. The diagonal line represents the viewer’s vergence and accommodation assuming accurate responses to the object. Vertical cross sections of the red region represent the eye’s depth of focus. Horizontal cross sections of the blue region represent Panum’s fusion area (15 arcmin). Note that the sizes of the zones of clear vision and of single vision remain constant in diopters. Because of this, we will express simulated and vergence distances in diopters instead of in meter-angles, which are the conventional units in optometry and ophthalmology. (B) Zones of clear single vision and of comfort. The green area represents the zone of clear single binocular vision: the range of vergence and accommodative responses that young adults can achieve without excessive effort and without exceeding depth of focus or Panum’s area. The yellow area represents Percival’s zone of comfort: the range of responses viewers can achieve without discomfort. Circles represent three real-world stimuli; squares represent the corresponding stimuli on a conventional 3D display.
Figure 3
Figure 3
Fixed-viewpoint, volumetric display. The IBM T221 LCD panel is viewed through semi-transparent and front-surface mirrors such that each eye sees three superimposed images. (A) Schematic. The left side is a top view. The T221 display is placed “face down” on top of the apparatus. Shaded rectangles represent the portions of the display surface that are the far, mid, and near image planes. Red lines represent left and right eyes’ lines of sight if the eyes are in parallel gaze (vergence = 0°). Periscope optics delivers the images to the eyes. The right side of Panel A is a side view. It shows the arrangement of the mirrors for creating each eye’s view. The images from the three planes travel different distances before arriving at the eyes. The far image plane is reflected off the front-surface mirror and transmitted through two semi-transparent mirrors. The near image plane is reflected off one semi-transparent mirror. (B) The focal distances of the image planes and the viewing frusta for the two eyes. The focal distances of the image planes are 31.1 (near), 39.4 (mid), and 53.6 cm (far) (3.21, 2.54, and 1.87 D; 0.67 D separations). The viewing frusta were skewed so that the binocular overlap was maximized at the far image plane. (C) The display is removed from the top to expose the mirrors. The apertures for viewing the stimuli are in the lower left. A worm gear allows the aperture separation to be adjusted to the observer’s inter-ocular distance. (D) An observer viewing stimuli with the display in place. Details in Akeley et al. (2004).
Figure 4
Figure 4
Pixel lighting with box and tent depth filters. The horizontal lines represent two image planes, the thick blue diagonal line the surface we wish to draw, and the thick blue horizontal lines the pixel intensities on the image planes; dark blue represents high intensity and pale blue represents low intensity. The box filter illuminates the far image plane at high intensity for all regions in which the simulated surface is closer to the far than the near plane. It illuminates the near plane at high intensity for all regions in which the simulated surface is closer to that plane. The tent filter weights intensities according to the proportion of the dioptric distance between the two image planes. This occurs along each line of sight. The sum of the two intensities is the same as the intensity on one plane in a conventional display. For details, see Akeley et al. (2004).
Figure 5
Figure 5
Retinal-image contrast for different displays and hypothetical accommodative responses. The top, middle, and bottom rows represent stimuli in the real world, in a conventional 3D display, and in our multi-plane display, respectively. The left, middle, and right columns represent spatial sinusoids of 2, 6, and 18 cpd, respectively. The abscissas are the actual or the simulated distance to the stimulus in diopters. The ordinates are the accommodative response in diopters. The colors represent contrast ratio: retinal-image contrast divided by stimulus contrast. The panels were generated based on the optical aberrations of the left eye of author DMH for a 4.5-mm pupil. His eye is emmetropic, so the maximum retinal contrast in the upper row occurs when the accommodative response is very close to the stimulus distance. The distance to the conventional 3D display was set at 2.5 D (40 cm). The secondary bands in the 6- and 18-cpd panels are caused by the ringing in the MTF of the defocused eye. The distances to the three planes in the multi-plane display were 1.87, 2.54, and 3.21 D, a range of 1.33 D. Wavefront measurements and analysis tools were provided by Austin Roorda, UC Berkeley.
Figure 6
Figure 6
The conditions in Experiments 1 and 2. The horizontal lines represent the image planes in the apparatus. The thin black lines represent the visual axes of the eyes; those axes intersect at the vergence distance. The light blue regions represent the focal distance. Panel A represents the fixation stimulus before the presentation of the test stimulus. Δ is the difference in diopters between the vergence and the focal distances. Panel B depicts eight of the test stimuli in the experiments. For the stimuli marked 3, 7, B, and E, the focal and the vergence distances were equal to one another (cues-consistent). The rightmost column, outlined in green, depicts the two stimuli with depth-weighted blending (see General methods section). In these stimuli, the vergence distance was the dioptric midpoint between two image planes; 50% of the light came from each of those planes. Panel C represents all the stimuli in the experiments. The horizontal dashed lines represent the three image planes. The vertical arrows represent the vergence distances. Stimuli at positions 1, 3, 4, 5, 6, 7, 9, A, B, C, D, E, and F were presented in Experiments 1 and 2; in B and E, the focal stimuli are depth-weighted blends. Experiment 3 used stimuli at 1–9. Experiment 4 used stimuli at 4, 5, and 6 for the cues-inconsistent session, and stimuli at 3, 5, and 7 in the cues-consistent session.
Figure 7
Figure 7
Results of Experiment 1. (A) Results for the non-blended stimuli. The abscissa represents the difference between the vergence and the focal distances (vergence minus focal) in diopters. The ordinate represents the stimulus duration required for the observer to correctly identify the orientation of the cyclopean stimulus 75% of the time. The data for the ±0.33 D conflicts are not shown. Different symbols represent the data from different observers: squares for ARG, triangles for DS, and circles for BGS. The blue filled symbols represent data when the vergence distance jumped from the mid to the far image plane; red unfilled symbols represent data when the vergence distance jumped from the mid to the near plane. Error bars are 95% confidence intervals. (B) Results for the cues-consistent stimuli. The abscissa represents the change in the vergence and the focal distance from the fixation to the test stimulus; positive values are changes in which the distance decreased and negative values are those in which the distance increased. The ordinate represents the stimulus duration required to correctly identify stimulus orientation 75% of the time. Different symbols represent data from different observers: purple squares for ARG, orange triangles for DS, and green circles for BGS. The unfilled symbols represent data with non-blended stimuli in which the focal and the vergence stimuli were at one of the image planes. The filled symbols are data with blended stimuli in which focal and vergence distance were between image planes. Error bars are 95% confidence intervals.
Figure 8
Figure 8
Results from Experiment 2. The format is the same as Figure 7 except the ordinate represents the highest spatial frequency at which observers could identify the corrugation orientation correctly 75% of the time. (A) Results for non-blended stimuli with near or far vergence distances. The abscissa represents the conflict between the vergence and the focal distances in diopters. The data for the ±0.33 D conflicts are not shown. Different symbol types represent the data from different observers: squares for ARG, triangles for DS, and circles for BGS. The blue filled symbols represent the data for far vergence distances and the red unfilled symbols the data for near vergence distances. Error bars represent 95% confidence intervals. (B) Results for cues-consistent stimuli. The abscissa represents the change in the vergence and the focal distance from the fixation to the test stimulus; positive values are changes in which the distance decreased and negative values are those in which the distance increased. Purple squares are data for ARG, orange triangles for DS, and green circles for BGS. The unfilled symbols are data with non-blended stimuli presented at an image plane, and the filled symbols are data with blended stimuli presented between image planes. Error bars are 95% confidence intervals.
Figure 9
Figure 9
The stimulus in Experiment 3. A random-dot stereogram depicting a vertical hinge in an open-book configuration. Observers indicated whether the perceived hinge angle was greater or less than 90 deg. The task could not be performed monocularly. The reader can see the 3D hinge by cross-fusing the stimulus. The experiment used a red stimulus on a black background but was reproduced here as black on white for clarity. The hinge is shown in plan view in Figure 1A.
Figure 10
Figure 10
Results from Experiment 3. Equivalent distance-the distance at which the disparity setting would correspond to a right angle-is plotted as a function of vergence distance. The left columns on each half of the figure show the data obtained with the conventional display. The right columns show the data obtained with the volumetric display. Each row on each half of the figure shows the data from a different observer. The abscissa in each plot is the vergence distance. The ordinate is the equivalent distance (Equation 5). The diagonal dashed lines represent the predicted data if equivalent distance were based solely on the vergence-specified distance. The red, green, and blue points represent the cues-inconsistent data from the near, mid, and far focal distances, respectively (note that 1/3 of those points are in fact cues-consistent). The colored lines are regression fits to those data points. Error bars are 95% confidence intervals. The black lines in the right column represent the data from the cues-consistent session.
Figure 11
Figure 11
Top: symptom questionnaire. Participants completed this questionnaire after each session. For each of the five questions, they indicated the severity of their symptoms at that moment. Bottom: display-evaluation questionnaire. Participants completed this questionnaire after the second session. For each of four questions, they indicated which session was better (or worse).
Figure 12
Figure 12
Results from the symptom questionnaire (Figure 11 top). The average severity of the reported symptom is plotted for each of the five questionnaire items. Blue bars are the average reported symptoms after the cues-inconsistent session, and orange bars are the average symptoms after the cues-consistent session. Larger values are associated with more severe symptoms. Error bars represent ±1 standard deviation. This graph shows data from 11 subjects, with six of them contributing twice. The double asterisks denote significantly worse symptoms reported in the cues-inconsistent, than the cues-consistent session (p < 0.025, Wilcoxon signed-rank test, one tailed).
Figure 13
Figure 13
Results from the display-evaluation questionnaire (Figure 11, bottom). The average comparative rating of a pair of sessions (one cues-consistent and one cues-inconsistent) is plotted for each of the four questionnaire items. The dashed horizontal line indicates a response of “no difference.” Values above that line indicate more favorable responses for the cues-consistent session. Error bars represent ±1 standard deviation. The graph shows data from 11 subjects, five of them contributing twice. (One subject misunderstood the instructions, and her first display-evaluation questionnaire was omitted.) Asterisks mean that the cues-consistent rating was significantly more favorable than the cues-inconsistent: double asterisks indicate p < 0.025; single asterisk indicates p < 0.05 (Wilcoxon signed-rank test, one tailed).
Figure 14
Figure 14
Retinal images with real-world and volumetric viewing. In each panel, the abscissa is the accommodative response in diopters and the ordinate is the retinal-contrast ratio: retinal-image contrast divided by object contrast. The real-world stimulus is always presented at 2.21 D. The volumetric stimulus is always presented on image planes at 1.87 and 2.54 D (represented by the arrows) to simulate an object at 2.21 D; this mimics the situation in our volumetric display. The dashed and the solid lines represent the contrast ratios created by real and volumetric stimuli, respectively; the shaded areas represent the difference. The stimulus in every case is a vertical sinusoidal grating. (A) The effect of viewer’s optical aberrations. Pupil diameter is 4 mm and stimulus spatial frequency is 6 cpd. The red, green, and blue curves represent respectively the contrast ratios for a diffraction-limited eye, the eye of a viewer with typical aberrations, and the eye of a viewer with larger-than-typical aberrations. (B) The effect of pupil size. The viewer has typical aberrations. The stimulus is 6 cpd. The red, green, and blue curves represent the contrast ratios for pupil diameters of 2, 4, and 6 mm, respectively. (C) The effect of stimulus spatial frequency. The viewer has typical aberrations and pupil diameter is 4 mm. The red, green, and blue curves represent the contrast ratios for spatial frequencies of 2, 6, and 18 cpd, respectively.
Figure 15
Figure 15
Salience of diplopia with and without blur. The stereograms depict two frontoparallel planes of sticks. In the upper stereogram, the sticks in the near and far planes are rendered sharp. In the lower stereogram, the sticks in the near plane are rendered sharp and the ones in the far plane are blurred. Cross fuse for the left pairs; divergently fuse for the right pairs.

Similar articles

Cited by

References

    1. Akeley K, Watt SJ, Girshick AR, Banks MS. A stereo display prototype with multiple focal distances. ACM Transactions on Graphics. 2004;23:804–813.
    1. Backus BT, Banks MS. Estimator reliability and distance scaling in stereoscopic slant perception. Perception. 1999;28:217–242. - PubMed
    1. Backus BT, Banks MS, van Ee R, Crowell JA. Horizontal and vertical disparity, eye position, and stereoscopic slant perception. Vision Research. 1999;39:1143–1170. - PubMed
    1. Baird JC, Biersdorf WR. Quantitative functions for size and distance judgments. Perception & Psychophysics. 1967;2:161–166.
    1. Banks MS, Gepshtein S, Landy MS. Why is spatial stereoresolution so low? Journal of Neuro-science. 2004;24:2077–2089. - PMC - PubMed

Publication types