. 2009 Jan;43(3):319-30.
doi: 10.1016/j.jpsychires.2008.03.012. Epub 2008 May 15.

Age-related gene expression in Tourette syndrome

Affiliations

Age-related gene expression in Tourette syndrome

Lisa Lit et al. J Psychiatr Res. 2009 Jan.

Abstract

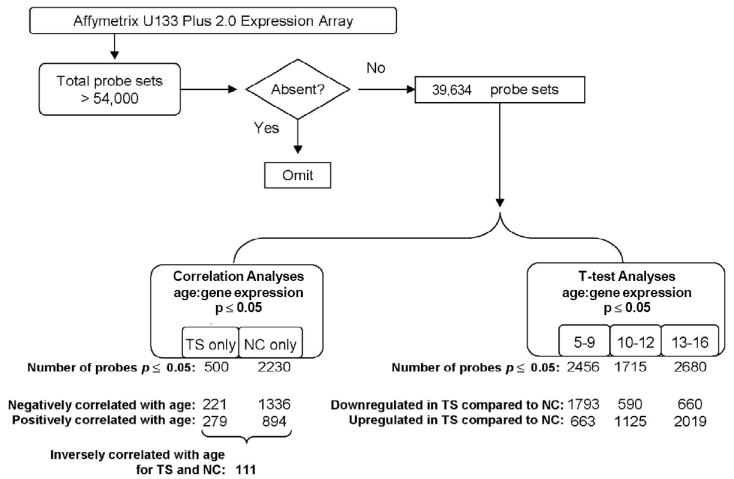
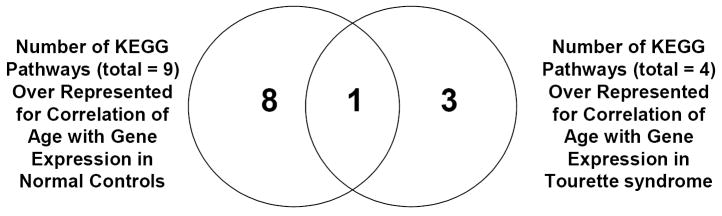
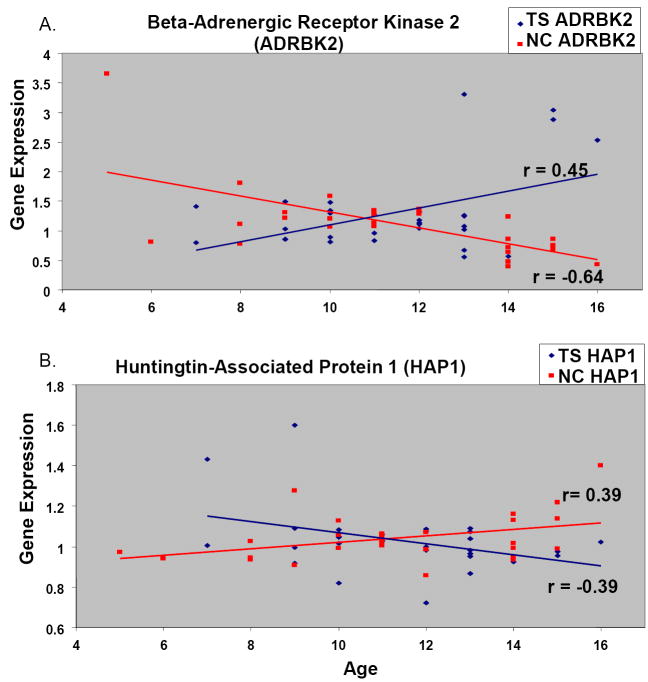
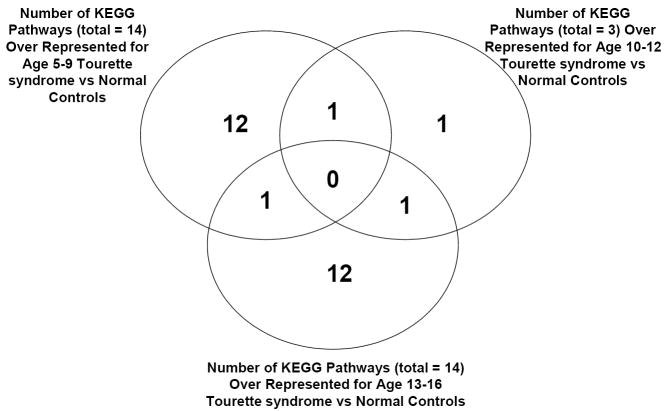
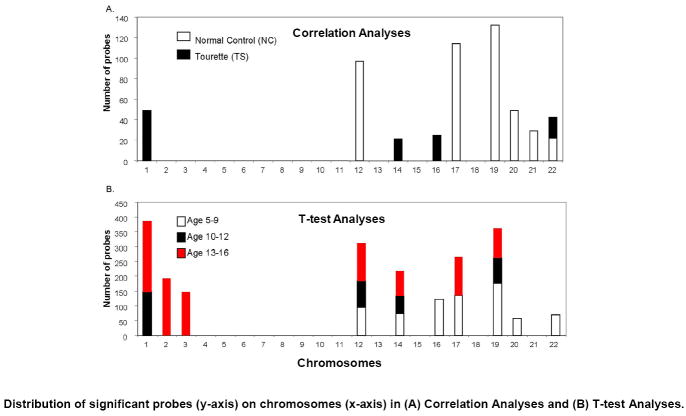
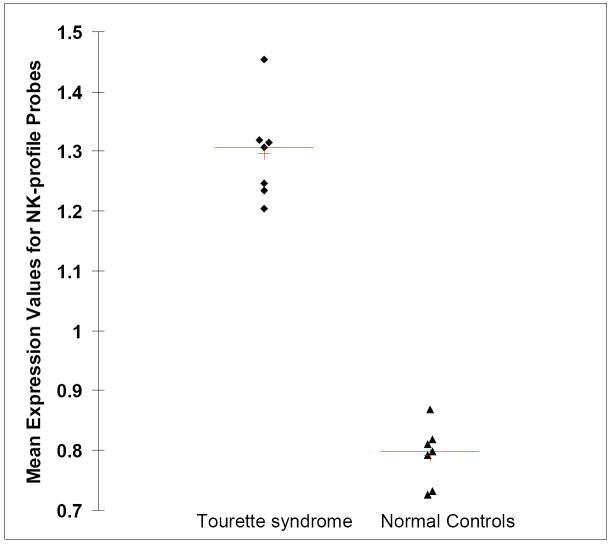
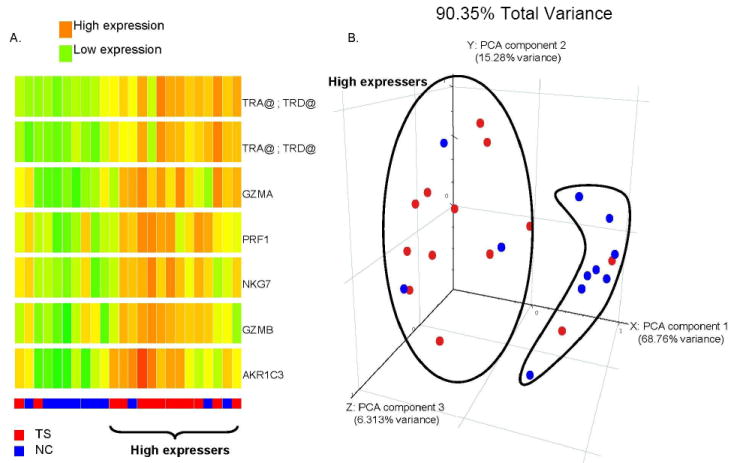
Because infection and immune responses have been implicated in the pathogenesis of Tourette syndrome (TS), we hypothesized that children with TS would have altered gene expression in blood compared to controls. In addition, because TS symptoms in childhood vary with age, we tested whether gene expression changes that occur with age in TS differ from normal control children. Whole blood was obtained from 30 children and adolescents with TS and 28 healthy children and adolescents matched for age, race, and gender. Gene expression (RNA) was assessed using whole genome Affymetrix microarrays. Age was analyzed as a continuous covariate and also stratified into three groups: 5-9 (common age for tic onset), 10-12 (when tics often peak), and 13-16 (tics may begin to wane). No global differences were found between TS and controls. However, expression of many genes and multiple pathways differed between TS and controls within each age group (5-9, 10-12, and 13-16), including genes involved in the immune-synapse, and proteasome- and ubiquitin-mediated proteolysis pathways. Notably, across age strata, expression of interferon response, viral processing, natural killer and cytotoxic T-lymphocyte cell genes differed. Our findings suggest age-related interferon, immune and protein degradation gene expression differences between TS and controls.


Figures

Figure 1
Figure 1
Analysis Algorithm. After excluding absent probe sets (probes with fluorescent values < 1; see Methods), two groups of statistical analyses were performed on the remaining 39,665 probes: (1) Correlation Analyses: Gene expression correlated with age for Tourette syndrome (TS), and gene expression correlated with age for normal controls (NC); and (2) T-test Analyses: mean difference in gene expression for TS vs NC, stratified by age group (5-9 years old, 10-12 years old, 13-16 years old). For all analyses, total number of probes significant at p ≤ 0.05 for each resulting probe list are shown. For Correlation Analyses, numbers of probes negatively and positively correlated with age are shown; for T-test Analyses, numbers of probes up regulated in TS compared to NC or down regulated in TS compared to NC are shown. For the correlation analyses, 111 probes were inversely correlated with age for TS and NC.
Figure 2
Figure 2
Venn Diagram illustrating numbers of significant pathways identified by DAVID (count threshold = 2, EASE threshold = 0.1) for Correlation Analyses probe lists: correlation of gene expression with age for normal controls (NC) (left circle) and correlation of gene expression with age for Tourette syndrome (TS) (right circle). Nine pathways are over represented by probes identified for correlation of gene expression with age for NC, with 8 pathways unique to NC and 1 pathway also over represented in TS. Four pathways are over represented by probes identified for correlation of gene expression with age for TS, with 3 pathways unique to TS and 1 pathway also over represented in NC.
Figure 3
Figure 3
Representative correlations between age and gene expression, shown for Tourette syndrome (TS) (dark blue) and normal control (NC) (red) subjects, demonstrating inverse correlation of expression with age. (A) Inverse correlation of gene expression with age for Beta-Adrenergic Receptor Kinase 2 in TS (blue) compared to NC (red) subjects. (B) Inverse correlation of gene expression with age for Huntingtin-Associated Protein for TS (blue) compared to NC (red) subjects.
Figure 4
Figure 4
Venn Diagram illustrating numbers of significant pathways identified by DAVID (count threshold = 2, EASE threshold = 0.1) for T-test Analyses probe lists: age 5-9 (left circle); age 10-12 (right circle); age 13-16 (bottom circle). Age 5-9 has 14 total pathways over represented, with 12 pathways unique to this age group, 1 pathway also over represented by age 10-12, and 1 pathway also over represented by age 13-16. Similarly, age 13-16 has 14 total pathways over represented, with 12 pathways unique to this age group, 1 pathway shared with age 5-9, and 1 pathway also over represented by age 10-12. Age 10-12 has 3 total pathways over represented by this age group, with 1 pathway also over represented by age 5-9 and 1 pathway also over represented by age 13-16. Note that no pathways are shared by all groups.
Figure 5
Figure 5
Significant probes identified within correlation analyses and t-test analyses show similar distributions across chromosomes. Table shows significant enrichment for genes (number of probe sets, Y axis) as identified by DAVID (count threshold = 2, EASE threshold = 0.1) on chromosome numbers 1-22 (X axis). (A) Correlation analyses of gene expression with age for normal controls (NC) (white bars) and Tourette Syndrome (TS) (black bars) probe lists. (B) T-test analyses for the three age groups: ages 5-9, white bars; ages 10-12, black bars; ages 13-16, red bars. X-axis shows chromosomes 1 to 22. Y-axis shows the number of probes located on each chromosome. No significant enrichment was detected on the X or Y chromosomes (not shown).
Figure 6
Figure 6
Scatter plot showing the group mean expression of 7 probes (representing 6 genes) previously identified in TS (Lit et al., 2007) for Tourette syndrome (left; diamonds) and Controls (right; triangles). The data represents the mean of the 13 Tourette subjects and 11 normal control subjects in the 10 to 12 year old age group. Range of fold changes for probes in this figure is 1.52 to 1.96.
Figure 7
Figure 7
(A) Unsupervised hierarchical cluster analysis of 7 probe sets (6 genes) (Y-axis) previously identified in TS (Lit et al., 2007) and also found significant in the current study (dependent t-test, p≤.0.05, fold change > |1.5|) for 13 Tourette’s Syndrome (TS) subjects (Red at bottom) compared to 11 control subjects (NC) (blue at bottom) (X-axis) in the 10-12 age group. High expression is red and low is green. (B) Principal Components Analysis scatter plot showing separation of most TS subjects (red) from normal controls (NC, blue) based on seven NK genes. The first three principal components were selected (accounting for >90% of the total variance) for visualization in a 3-dimensional figure. Red, TS; Blue, NC.

References

    1. A.P.A. Diagnostic and statistical manual of mental disorders: DSM-IV-TR. 4. Washington, DC: American Psychiatric Association; 2000.
    1. Allen AJ, Leonard HL, Swedo SE. Case study: a new infection-triggered, autoimmune subtype of pediatric OCD and Tourette’s syndrome. J Am Acad Child Adolesc Psychiatry. 1995;34:307–11. - PubMed
    1. Barnes BJ, Moore PA, Pitha PM. Virus-specific activation of a novel interferon regulatory factor, IRF-5, results in the induction of distinct interferon alpha genes. J Biol Chem. 2001;276:23382–90. - PubMed
    1. Bennett EJ, Bence NF, Jayakumar R, Kopito RR. Global impairment of the ubiquitin-proteasome system by nuclear or cytoplasmic protein aggregates precedes inclusion body formation. Mol Cell. 2005;17:351–65. - PubMed
    1. Bolstad BM, Irizarry RA, Astrand M, Speed TP. A comparison of normalization methods for high density oligonucleotide array data based on variance and bias. Bioinformatics. 2003;19:185–93. - PubMed

Publication types