. 2008 May 16;133(4):585-600.
doi: 10.1016/j.cell.2008.03.031.

SMN deficiency causes tissue-specific perturbations in the repertoire of snRNAs and widespread defects in splicing

Affiliations

SMN deficiency causes tissue-specific perturbations in the repertoire of snRNAs and widespread defects in splicing

Zhenxi Zhang et al. Cell. .

Abstract

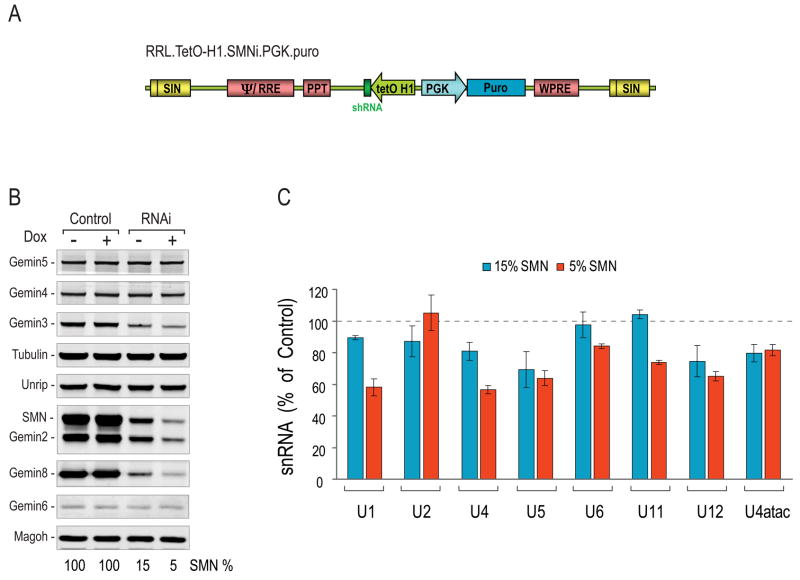
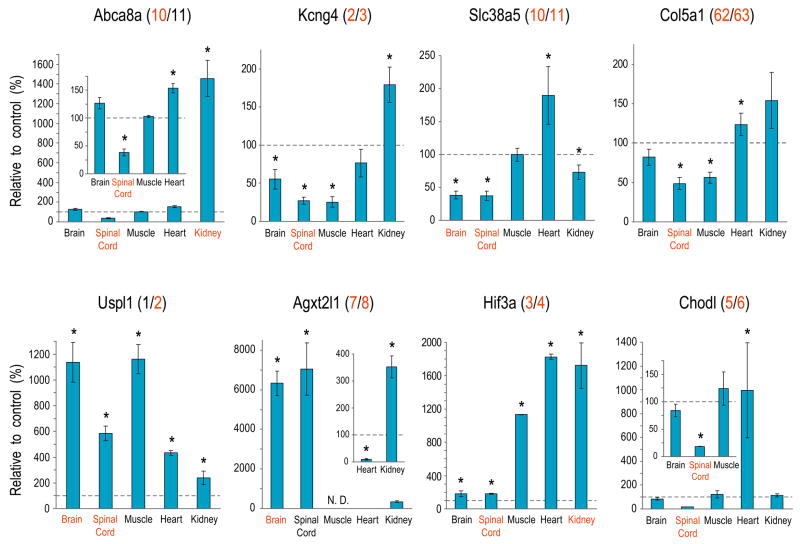
The survival of motor neurons (SMN) protein is essential for the biogenesis of small nuclear RNA (snRNA)-ribonucleoproteins (snRNPs), the major components of the pre-mRNA splicing machinery. Though it is ubiquitously expressed, SMN deficiency causes the motor neuron degenerative disease spinal muscular atrophy (SMA). We show here that SMN deficiency, similar to that which occurs in severe SMA, has unexpected cell type-specific effects on the repertoire of snRNAs and mRNAs. It alters the stoichiometry of snRNAs and causes widespread pre-mRNA splicing defects in numerous transcripts of diverse genes, preferentially those containing a large number of introns, in SMN-deficient mouse tissues. These findings reveal a key role for the SMN complex in RNA metabolism and in splicing regulation and indicate that SMA is a general splicing disease that is not restricted to motor neurons.


Figures

Figure 1
Figure 1. Severe reduction of SMN in HeLa cells causes a strong decrease in snRNPs
(A) Schematic representation of the RRL.TetO-H1.SMNi.PGK.puro lentiviral vector in its proviral form. The U3 region is deleted in both LTRs (SIN, self inactivating; Y, packaging signal; RRE, REV responsive element; PPT, central poly-purine tract; tetO-H1, tetracycline inducible H1 promoter; PGK, phosphoglycerol kinase promoter; Puro, puromycin resistance gene; WPRE, woodchuck hepatitis virus post-transcriptional regulatory element). (B) Total protein extracts were prepared from HeLa T-REx cells stably expressing shRNAs against mouse SMN (Control) or human SMN (RNAi) without (−) or with (+) doxycycline. SMN complex components were detected by quantitative Western blot, using α-tubulin and Magoh as loading controls. (C)Total RNA was isolated from Control and RNAi HeLa T-REx cells without (15% SMN, blue columns) or with (5% SMN, red columns) doxycycline. snRNA levels were quantitated by real-time RT-PCR. The snRNA levels of the SMN RNAi cells are plotted as % of control. Same RNAi and snRNA quantitation experiments were done at least three times and one typical experiment was shown. 5S and 5.8S rRNAs levels were used to normalize the RNA input and produced very similar results, therefore only 5S rRNA-normalized data are presented here and in all subsequent real-time RT-PCR measurements for snRNA. The error bars are propagated between SMN and control RNAi samples using the formula: δ(x/y)/(x/y)=(δx/x)2+(δy/y)2 (δ: SD; x: SMA; y: Cont).
Figure 2
Figure 2. A decrease in SMN complex proteins results in diminished snRNP assembly capacity in SMA mice
(A) Total protein extracts were prepared from brain and kidney of P6 control and SMA mice. SMN and Gemin proteins were detected by quantitative Western blot, using α-tubulin and Magoh as loading controls. (B) Total protein extracts were prepared as in (A) from P6 control (n=2) and SMA (n=3) mice and snRNP assembly capacities were examined with biotinylated U4 snRNA. Data are presented after subtraction of the background signal relative to U4 ΔSm snRNA. SMN complex activities from various SMA extracts (red columns) were quantitated in comparison to control extract (blue columns). Error bars indicate SD.
Figure 3
Figure 3. A decrease in SMN complex proteins results in tissue- and snRNP-specific reduction of snRNAs in SMA mice
Total RNA was purified from brain of P6 control (n=2) and SMA (n=3) mice, and brain, spinal cord, heart, skeletal muscle, and kidney of P11 control (n=4) and SMA (n=3) mice. Real-time RT-PCR was performed to determine snRNA levels in each tissue. The relative amount of each snRNA in SMA mice tissues was plotted as % of the controls. Error bars were calculated as in Figure 1C (*P <0.01).
Figure 4
Figure 4. Confirmation of predicted changes in exon expression levels
Exon junction-specific primer/probe sets (indicated in parenthesis after the gene name) were used to measure affected exons from eight genes by real-time RT-PCR, using total RNA prepared from brain, spinal cord, muscle, heart, and kidney tissues of control (n=4) and SMA (n=3) mice. Total RNA inputs were normalized by Gapdh mRNA levels. Exon levels of SMA samples were plotted as % of controls. The affected exons and tissues predicted by exon arrays are highlighted in red. Error bars were calculated as in Figure 1C (* P < 0.05).
Figure 5
Figure 5. Summary of exon array data and validation for representative genes
Fold-changes of probe sets detecting exon levels (SMA vs. control) are shown on top of the corresponding exon of each gene structure. Note some exons are measured by multiple probesets, while some do not have any targeting probe sets and are not shown in the gene structure. RT-PCR (R), real-time RT-PCR (Q), and sequencing (S) validation reactions are indicated below the gene structure.
Figure 6
Figure 6. Confirmation of expression and splicing pattern changes by HT RT-PCR reactions
HT RT-PCR reactions characterizing expression and splicing pattern changes of four genes are shown as electrophoregrams. Sizes and molarities of RT-PCR products are listed above the electrophoregrams, and the sizes and migrating times of markers can be found below. Blue and red arrows indicate PCR products representing splicing pattern changes in control and SMA mice, respectively. Relevant PCR products (peaks) were also illustrated by schematic gene structures with predicted sizes. Solid black circles above the exon structures represent primer binding regions.

Comment in

References

    1. Baccon J, Pellizzoni L, Rappsilber J, Mann M, Dreyfuss G. Identification and characterization of Gemin7, a novel component of the survival of motor neuron complex. J Biol Chem. 2002;277:31957–31962. - PubMed
    1. Balabanian S, Gendron NH, MacKenzie AE. Histologic and transcriptional assessment of a mild SMA model. Neurol Res. 2007;29:413–424. - PubMed
    1. Battle DJ, Kasim M, Yong J, Lotti F, Lau CK, Mouaikel J, Zhang Z, Han K, Wan L, Dreyfuss G. The SMN complex: an assembly machine for RNPs. Cold Spring Harb Symp Quant Biol. 2006a;71:313–320. - PubMed
    1. Battle DJ, Lau CK, Wan L, Deng H, Lotti F, Dreyfuss G. The Gemin5 protein of the SMN complex identifies snRNAs. Mol Cell. 2006b;23:273–279. - PubMed
    1. Black DL. Mechanisms of alternative pre-messenger RNA splicing. Annu Rev Biochem. 2003;72:291–336. - PubMed

Publication types

MeSH terms

Substances