

doi: 10.1016/j.cell.2008.02.051.
Nucleosome retention and the stochastic nature of promoter chromatin remodeling for transcription
Affiliations
- PMID: 18485878
- PMCID: PMC2409070
- DOI: 10.1016/j.cell.2008.02.051
Item in Clipboard
Nucleosome retention and the stochastic nature of promoter chromatin remodeling for transcription
Cell.
.
Abstract
The rate-limiting step of transcriptional activation in eukaryotes, and thus the critical point for gene regulation, is unknown. Combining biochemical analyses of the chromatin transition at the transcriptionally induced PHO5 promoter in yeast with modeling based on a small number of simple assumptions, we demonstrate that random removal and reformation of promoter nucleosomes can account for stochastic and kinetic properties of PHO5 expression. Our analysis suggests that the disassembly of promoter nucleosomes is rate limiting for PHO5 expression, and supports a model for the underlying mechanism of promoter chromatin remodeling, which appears to conserve a single nucleosome on the promoter at all times.
Figures
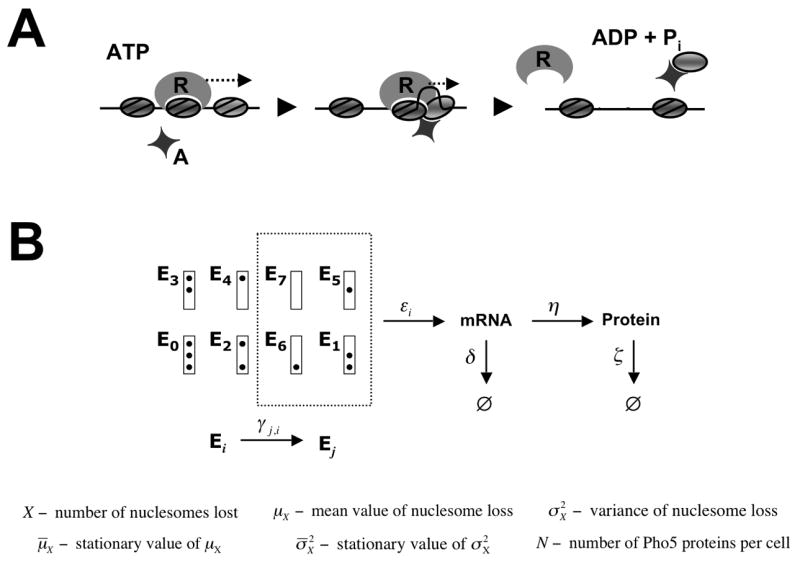
(A) Sliding mediated nucleosome disassembly. Not the nucleosome bound by the remodeler R, but an adjacent nucleosome is disassembled as a consequence of nucleosome sliding catalyzed by R. Histone acceptors, A, may be required for complete unwrapping of the DNA from the histone octamer. Nucleosomes are represented by grey ovals. (B) Promoter nucleosome configurations E 0, …,E 7. The box represents the promoter, and dots indicate occupied nucleosome positions, with nucleosome positions N-1 (the core promoter), N-2, and N-3 at the top, middle, and bottom, respectively. Under repressing conditions the promoter is found in nucleosome configuration E 0 with probability 1, but randomly jumps between configurations Ei under activating conditions. Only configurations Ei that lack a nucleosome in position N-1, i.e. i ∊ {1,5,6,7}, are transcriptionally competent.
Predicted time-evolution of μX, the mean number of nucleosome loss (blue graphs), and
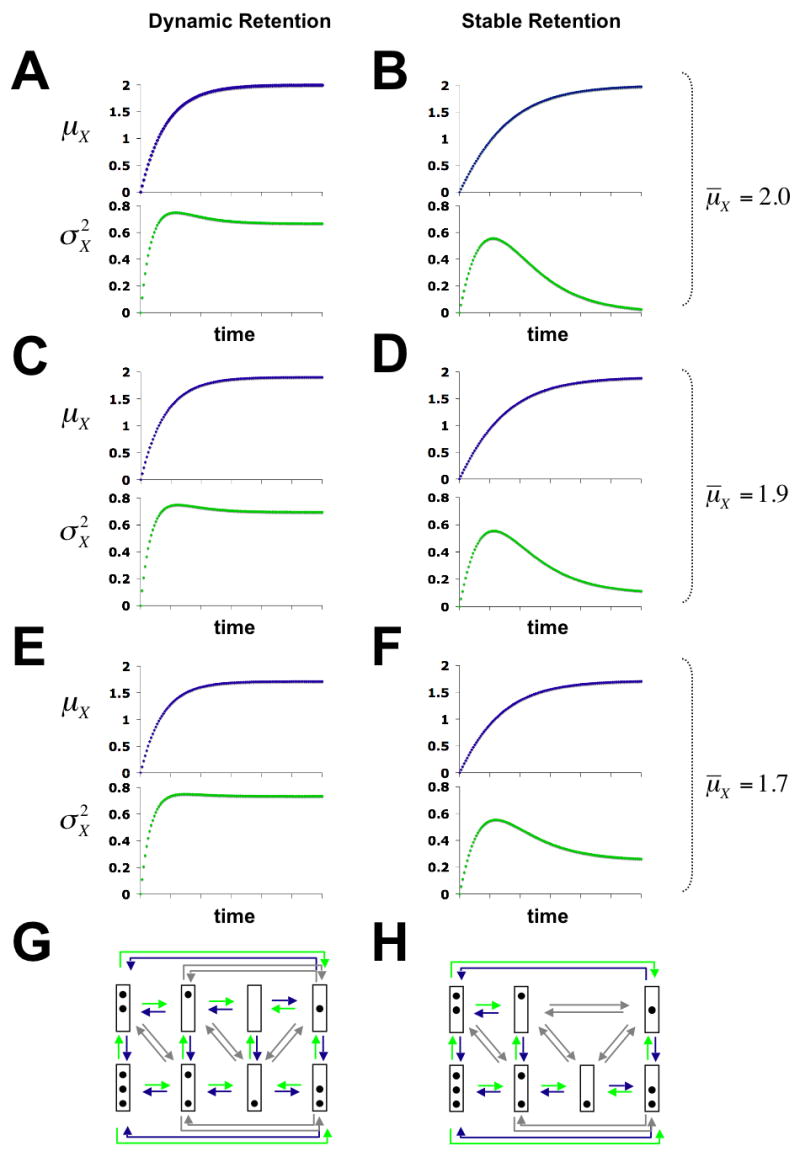
, the variance of nucleosome loss (green graphs) for dynamic (A, C, E, G), and stable (B, D, F, H) retention of nucleosomes at different values of μ̄X. Panels at the bottom show the chromatin transition topologies for both models of nucleosome retention. Nucleosome disassembly, reassembly and sliding transitions are indicated by green, blue, and grey arrows, respectively. Time-evolutions were calculated from solutions to the system of differential equations (7) (Methods). For A, C, …, E the ratios γd/γr are 2, 10, 1.74, 3.17, and 1.33, respectively. For B the ratio is not defined, since γr = 0.
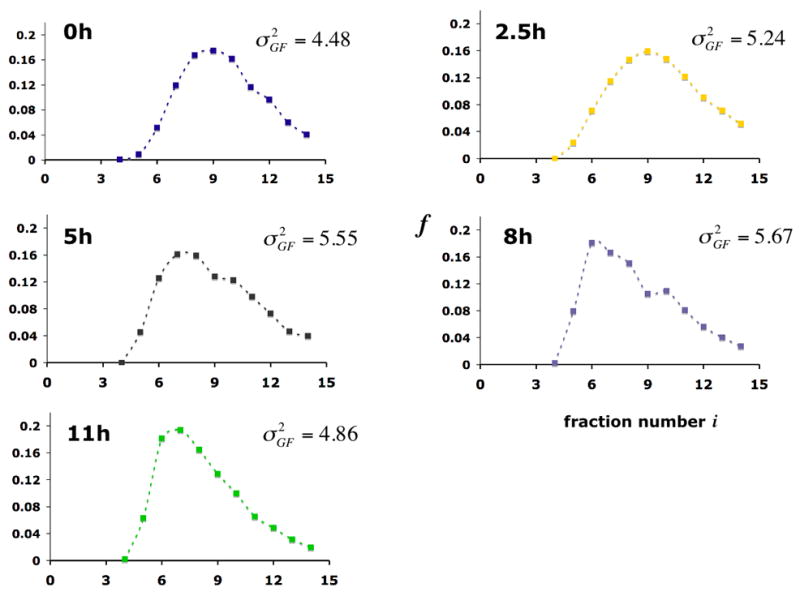
Gel filtration profiles of promoter chromatin circles at various times after induction of PHO5 expression. Promoter circles were fractionated on a Sephadex TSK 4000 SW column, and the fraction fi of all circles in column fraction i was determined by southern blotting with a radioactively labeled circle DNA probe. The variance of the gel filtration profile
, where
(mass center of the profile), is indicated at the right.
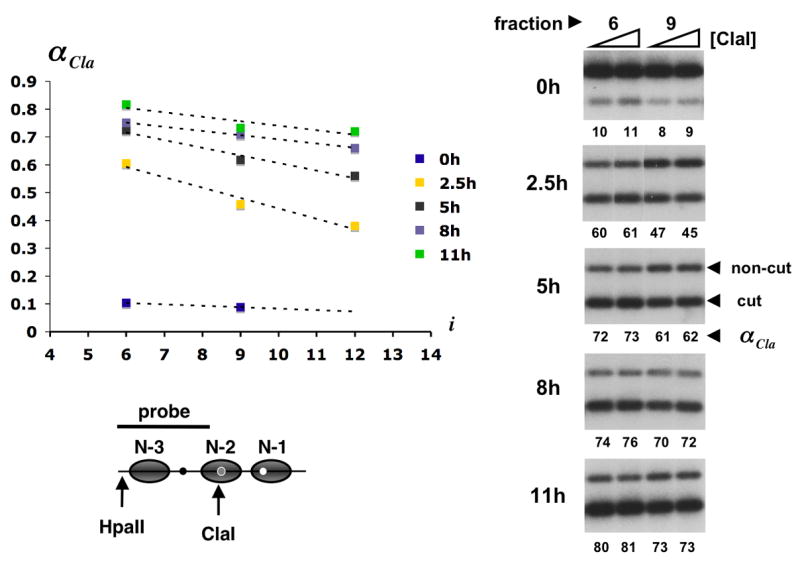
Cla I accessibility across gel filtration profiles from Fig. 1. About 20 attomol of promoter circles from column fractions 6 and 9 (0 h after induction) or fractions 6, 9, and 12 (2.5, 5, 8, and 11 h after induction) were digested in 300 μl with 20 and 60 u of Cla I for 30 min at 37°C. Circle DNA was extracted, digested to completion with Hpa II, separated in a 2% agarose gel, blotted and hybridized with the radioactively labeled DNA probe indicated in the promoter diagram at the bottom of the figure (gray ovals represent nucleosome core particles; black, grey, and white dots represent UASp1, UASp2, and the TATA box, respectively). Primary data for fractions 6 and 9 are shown on the right. The lower and upper bands represent circles cut and not cut by Cla I. The fraction of circles cut, αCla, is indicated as a percentage beneath each lane. The mean of αCla at 20 and 60 u of Cla I was plotted against the column fraction number i = 4,…,14 (upper left). Cla I accessibility gradients were determined by linear regression.
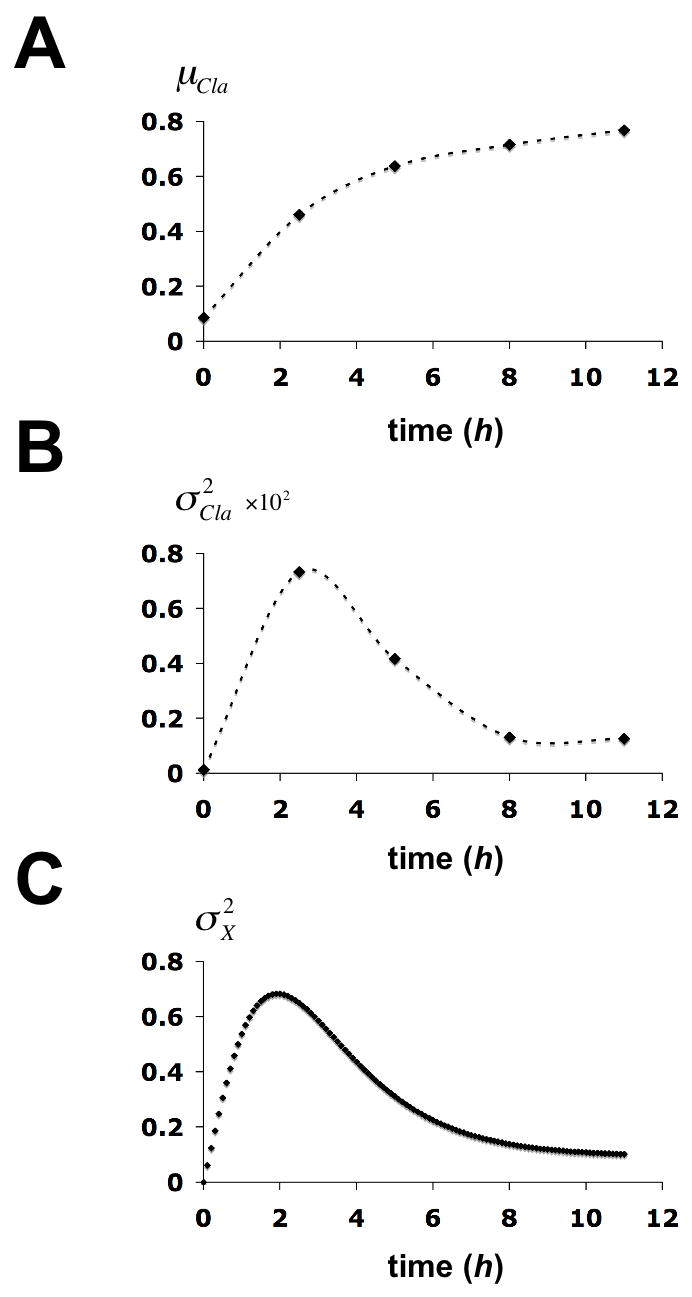
Time evolution of statistical parameters for the chromatin structure transition at the PHO5 promoter. (A) The mean of Cla I accessibility of the gel filtration profile at time t after induction, μα(t), is plotted against the time. (B) The variance of Cla I accessibility of the gel filtration profile at time t,
, is plotted against the time. (C) The variance in X at time t,
, was calculated from the solution to equation (7) (Methods) and plotted against time. Calculations were based on the chromatin transition topology of Fig. 2B with γj, 0 = 0.2 h−1 for j ∈ {1,2,3}, γj, i = 2 · γj,0 for all (j, i) with i ∈ {1,2,3} and j ∈ {4,5,6},γ0,i = 0.1 · γj,0 for i ∈ {1,2,3},γj,i = 0.2 · γj,0 for all (j, i) with i ∈{4,5,6} and j ∈{1,2,3}, and γj,i = 2 · γj,0 for all sliding transitions.
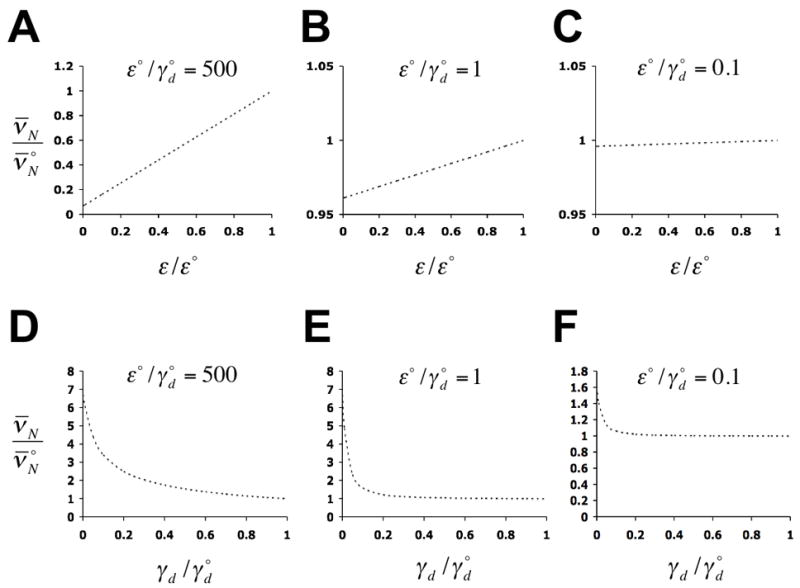
Predicted dependence of the stationary intrinsic noise strength of expression, ν̄N, on the rate of transcription (A – C), and on the rate of nucleosome disassembly (D – F), with all other rate constants held constant. The maximum rates of transcription and nucleosome disassembly are designated as ε° and
, respectively, where
refers to ν̄N at ε = ε° and
. Predictions were calculated from solutions to equations (15) (Methods), with δ = 10 h−1, ζ = 0.7 h−1, η = 20 h−1, ε° = 100 h−1, εi ≡ ε for i ∈ {1,5,6}, εi = 0 for i ∈{2,3,4}, and γj,0 ≡ γd for i ∈ {1,2,3}, all other γj,i are then given by the relations of Fig. 5C.
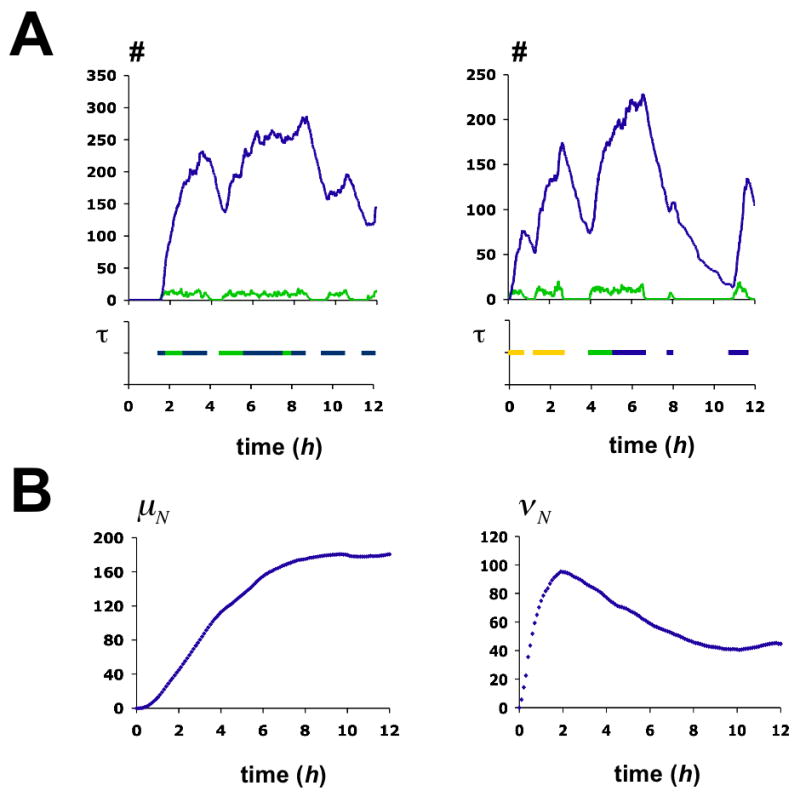
Stochastic simulation of the activation process. (A) Two examples of single simulation runs over 12 hours. Graphs in the upper panels show the time-evolution of protein (blue) and mRNA (green). The pertaining chromatin transitions are indicated in the panels below. The function τ equals 1 if the promoter is in either one of the three transcriptionally competent nucleosome configurations E1 (yellow), E 5 (blue), E 6 (green), and is 0 otherwise. Monte Carlo simulations were performed using Gillespie’s algorithm (Gillespie, 1976). (B) Time-evolution of the mean number of Pho5p molecules, μN, and the intrinsic noise strength of Pho5p expression, νN. Statistics were derived from 1000 simulations. Chromatin transition rates γj,i are given in the legend to Fig. 5C. All other rates are as indicated in the legend to Fig. 6.
References
-
- Adkins MW, Howar SR, Tyler JK. Chromatin disassembly mediated by the histone chaperone Asf1 is essential for transcriptional activation of the yeast PHO5 and PHO8 genes. Mol Cell. 2004;14:657–666. - PubMed
-
- Bar-Even A, Paulsson J, Maheshri N, Carmi M, O’Shea E, Pilpel Y, Barkai N. Noise in protein expression scales with natural protein abundance. Nat Genet. 2006;38:636–643. - PubMed
Publication types
MeSH terms
Substances
Grants and funding
LinkOut - more resources
Full Text Sources
Other Literature Sources
Molecular Biology Databases
