. 2008 Jun;15(6):693-701.
doi: 10.1016/j.acra.2007.10.009.

Helium-3 diffusion MR imaging of the human lung over multiple time scales

Affiliations

Helium-3 diffusion MR imaging of the human lung over multiple time scales

John P Mugler 3rd et al. Acad Radiol. 2008 Jun.

Abstract

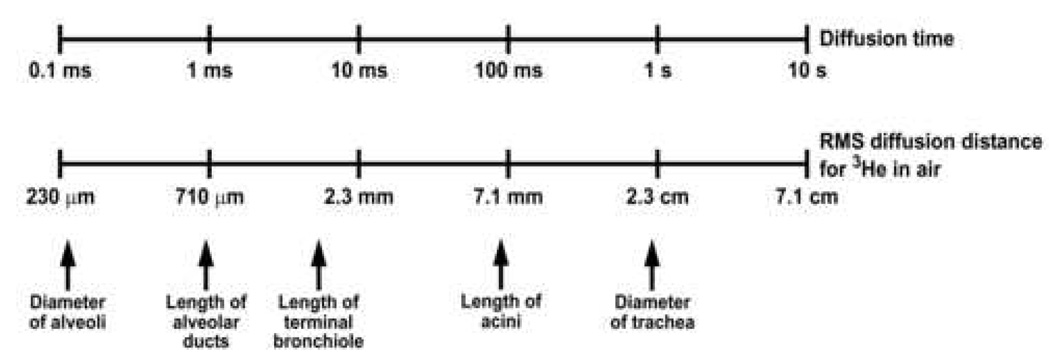
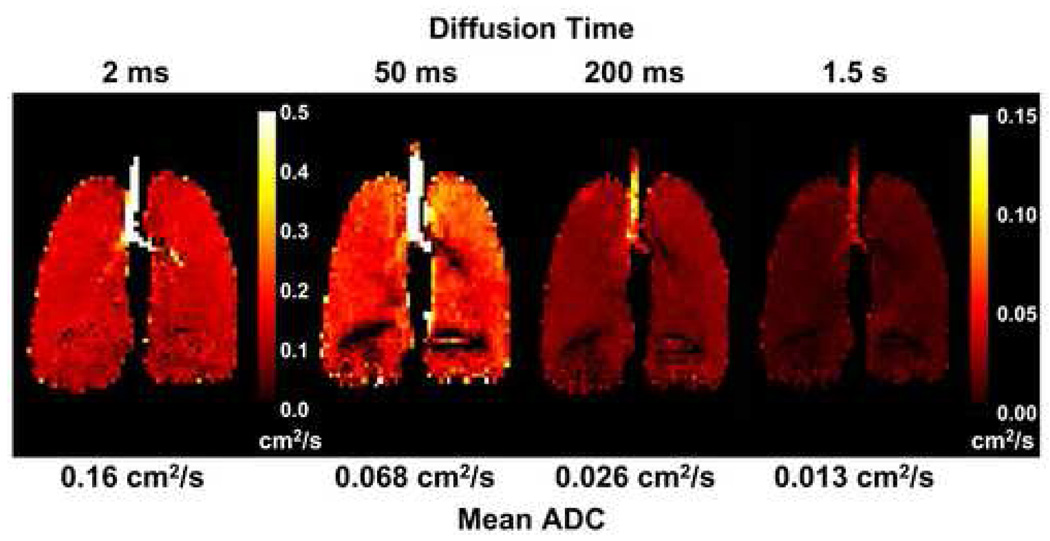
Rationale and objectives: Diffusion magnetic resonance imaging (MRI) with hyperpolarized (3)He gas is a powerful technique for probing the characteristics of the lung microstructure. A key parameter for this technique is the diffusion time, which is the period during which the atoms are allowed to diffuse within the lung for measurement of the signal attenuation. The relationship between diffusion time and the length scales that can be explored is discussed, and representative, preliminary results are presented from ongoing studies of the human lung for diffusion times ranging from milliseconds to several seconds.

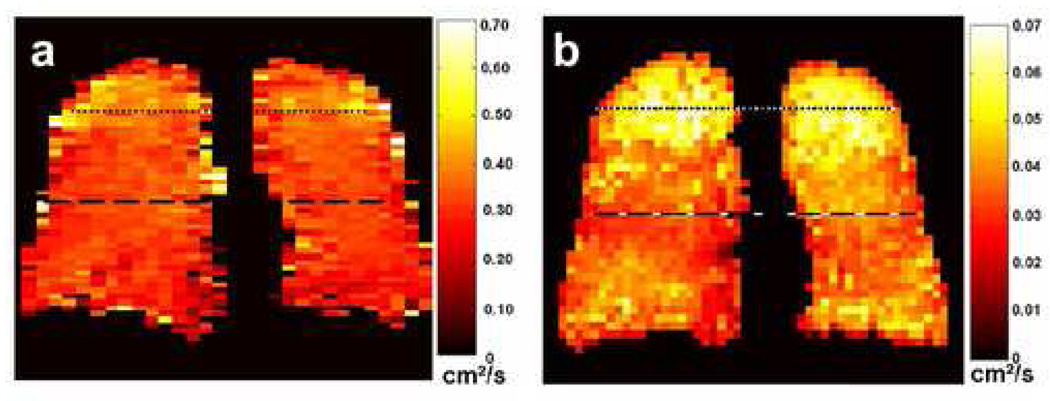
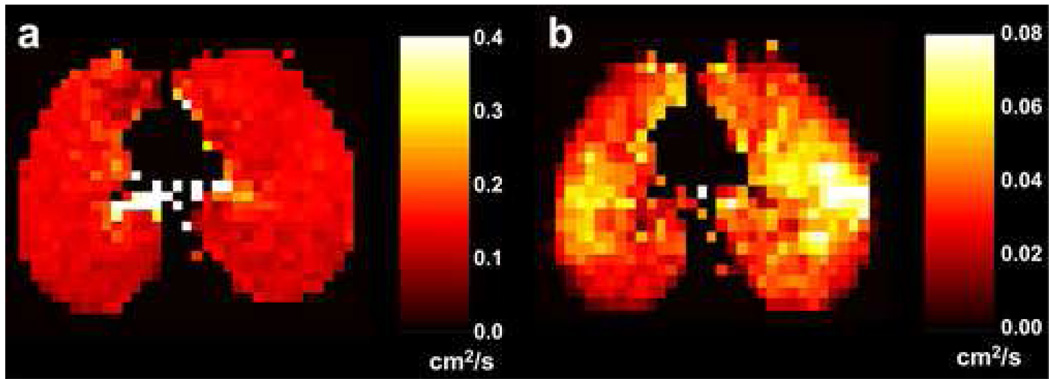
Materials and methods: (3)He diffusion MRI of the human lung was performed on a 1.5T Siemens Sonata scanner. Using gradient echo-based and stimulated echo-based techniques for short and medium-to-long diffusion times, respectively, measurements were performed for times ranging from 2 milliseconds to 6.5 seconds in two healthy subjects, a subject with subclinical chronic obstructive pulmonary disease and a subject with bronchopulmonary dysplasia.

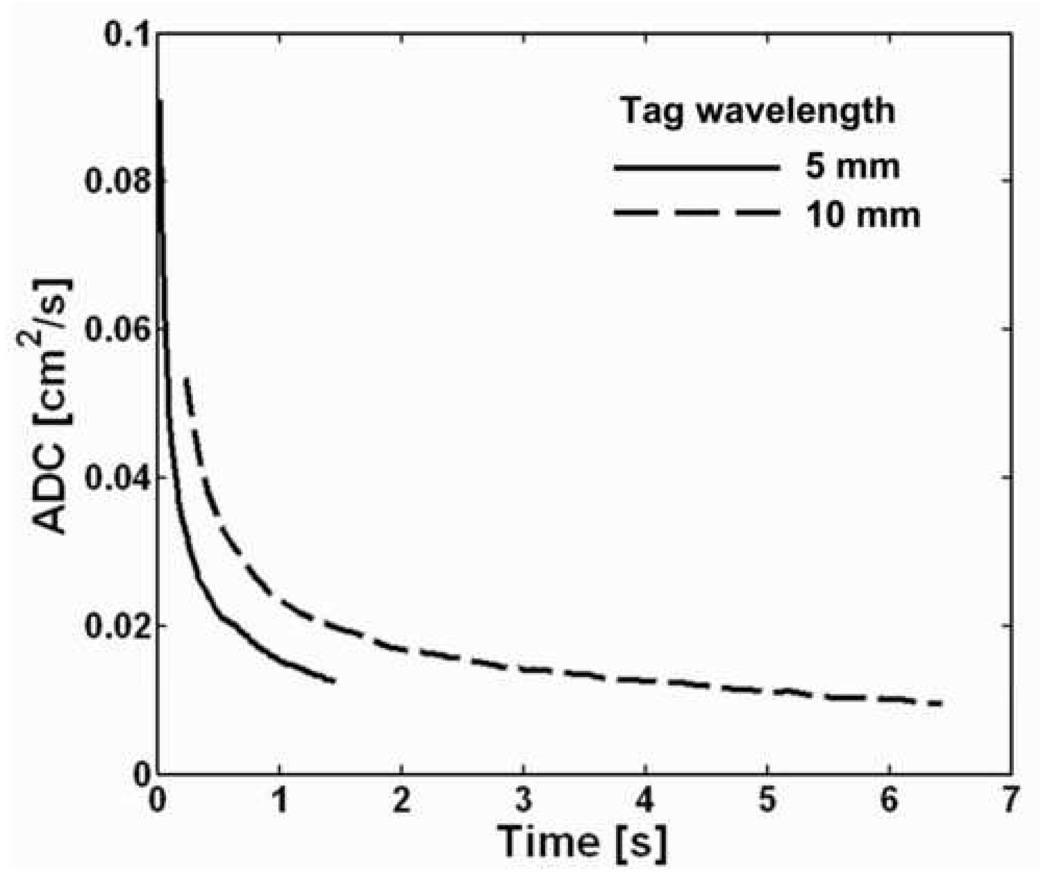
Results: In healthy subjects, the apparent diffusion coefficient decreased by about 10-fold, from approximately 0.2 to 0.02 cm(2)/second, as the diffusion time increased from approximately 1 millisecond to 1 second. Results in subjects with disease suggest that measurements made at diffusion times substantially longer than 1 millisecond may provide improved sensitivity for detecting certain pathologic changes in the lung microstructure.

Conclusions: With appropriately designed pulse sequences it is possible to explore the diffusion of hyperpolarized (3)He in the human lung over more than a 1,000-fold variation of the diffusion time. Such measurements provide a new opportunity for exploring and characterizing the microstructure of the healthy and diseased lung.


Figures

Figure 1
Figure 1
a: Basic framework for making an ADC measurement based on a gradient-echo pulse sequence. Spatial encoding gradients, which would be applied following the “un-tag” gradient pulse, are omitted for simplicity. b: The effect of the tagging gradient pulse on the transverse magnetization. The left side of the diagram shows a series of representative transverse magnetization vectors before application of the tagging pulse. The tips of these magnetization vectors fall along a straight line. The gradient twists the magnetization vectors into a helical pattern as shown on the right side of the diagram.
Figure 2
Figure 2
Basic framework for making an ADC measurement based on a stimulated-echo pulse sequence. Spatial encoding gradients are omitted for simplicity. The “un-tag” gradient pulse is positive (instead of negative) because the second RF pulse phase conjugates the magnetization in the process of storing it.
Figure 3
Figure 3
Relationship between the diffusion time and the RMS distance that 3He atoms in air diffuse in an unrestricted environment. The approximate dimensions of several structures in the human lung are indicated for comparison.
Figure 4
Figure 4
Global ADC values from the lung of a healthy human volunteer for diffusion times ranging from 20 ms to 6.5 s. ADC values for diffusion times from 20 ms to 1.5 s were measured during a breath-hold using a tag wavelength of 5 mm. ADC values for diffusion times from 200 ms to 6.5 s were measured during a second breath-hold using a tag wavelength of 10 mm. For a given tag wavelength, the ADC decreased monotonically with increasing diffusion time. Each of the two measurements was performed using a single application of a stimulated-echo-based pulse sequence with the following parameters: TR, 62 ms; TE for stimulated echoes, 6.0 ms; TE for calibration data, 0.5 ms; flip angle, 5°; number of ADC values per measurement, 24 (5-mm tag wavelength) or 102 (10-mm tag wavelength).
Figure 5
Figure 5
Coronal projection ADC maps from the lung of a healthy human volunteer for diffusion times ranging from 2 ms to 1.5 s. Each ADC map was acquired during a separate breath-hold period. The short-time-scale ADC map (diffusion time: 2 ms) was acquired using a gradient-echo-based pulse sequence, and the medium- and long-time-scale ADC maps (diffusion times: 50, 200 and 1500 ms) were acquired using a stimulated-echo-based pulse sequence. The ADC values decreased monotonically with increasing diffusion time, consistent with the behavior for global ADC values illustrated in Fig 4. The artifactual dark regions near the base of the lung were caused by the large susceptibility interface at the diaphragmatic surface. Parameters for the gradient-echo acquisition included: TR, 6.3 ms; TE, 4.5 ms; flip angle, 10°; b values, 0 and 1.6 s/cm2; diffusion-sensitization direction, anterior-posterior. Parameters for the stimulated-echo acquisition included: TR, 8.0 ms; TE for stimulated echo, 7.0 ms; TE for diffusion-weighted image, 2.3 ms; TE for calibration data, 3.6 ms; flip angle, 5°; tag wavelength, 5 mm (diffusion time 50 or 200 ms) or 10 mm (diffusion time 1500 ms); diffusion-sensitization direction, anterior-posterior. Parameters common to both acquisitions included: in-plane resolution, 5.9 × 5.9 mm2; slice thickness, projection. Adapted from Fig 2 in reference (20).
Figure 6
Figure 6
Coronal short-time-scale (a) and long-time-scale (b) ADC maps from a subject with sub-clinical COPD. The diffusion times were 2 ms and 1.5 s for the short-time-scale and long-time-scale measurements, respectively. The long-time-scale ADC map exhibits markedly elevated ADC values in the lung apices; the values in the mid-section and base of the lung are also elevated compared to those for a healthy subject (e.g., Fig 5, right-most ADC map). In contrast, the short-time-scale ADC values in the lung apices are only mildly elevated compared to those in the rest of the lung. Parameters for the short-time-scale, gradient-echo acquisition included: TR, 6.3 ms; TE, 4.5 ms; flip angle, 10°; in-plane resolution, 5.0 × 10.0 mm2; slice thickness, projection; b values, 0 and 1.6 s/cm2; diffusion-sensitization direction, anterior-posterior. Parameters for the long-time-scale, stimulated-echo acquisition included: TR, 6.4 ms; TE for stimulated echoes, 7.0 ms; TE for calibration data, 1.3 ms; flip angle, 5°; in-plane resolution, 6.3 × 7.3 mm2; slice thickness, projection; tag wavelength, 10 mm; diffusion-sensitization direction, anterior-posterior. Adapted from Fig 9 in reference (10).
Figure 7
Figure 7
Axial short-time-scale (a) and long-time-scale (b) ADC maps from a subject with bronchopulmonary dysplasia. The diffusion times were 2 ms and 1.0 s for the short-time-scale and long-time-scale measurements, respectively. The ADC values are quite uniform within the lung parenchyma in the short-time-scale ADC map (the elevated values are gas within large airways), while local elevations of the ADC are seen in both lungs in the long-time-scale ADC map. Parameters for the short-time-scale, gradient-echo acquisition included: TR, 11.0 ms; TE, 6.7 ms; flip angle, 3°; b values, 0 and 1.6 s/cm2; diffusion-sensitization direction, head-foot. Parameters for the long-time-scale, stimulated-echo acquisition included: TR, 6.4 ms; TE for stimulated echoes, 7.0 ms; TE for calibration data, 1.3 ms; flip angle, 5°; tag wavelength, 10 mm; diffusion-sensitization direction, head-foot. Parameters common to both acquisitions included: in-plane resolution, 5.9 × 5.9 mm2; slice thickness, 40 mm.

References

    1. Moller HE, Chen XJ, Saam B, et al. MRI of the lungs using hyperpolarized noble gases. Magn Reson Med. 2002;47(6):1029–1051. - PubMed
    1. van Beek EJ, Wild JM, Kauczor HU, et al. Functional MRI of the lung using hyperpolarized 3-helium gas. J Magn Reson Imaging. 2004;20(4):540–554. - PubMed
    1. Altes TA, Powers PL, Knight-Scott J, et al. Hyperpolarized 3He MR lung ventilation imaging in asthmatics: preliminary findings. J Magn Reson Imaging. 2001;13(3):378–384. - PubMed
    1. de Lange EE, Altes TA, Patrie JT, et al. Evaluation of asthma with hyperpolarized helium-3 MRI: correlation with clinical severity and spirometry. Chest. 2006;130(4):1055–1062. - PubMed
    1. Saam BT, Yablonskiy DA, Kodibagkar VD, et al. MR imaging of diffusion of 3He gas in healthy and diseased lungs. Magn Reson Med. 2000;44(2):174–179. - PubMed

Publication types