. 2008 Jun 15;75(12):2334-44.
doi: 10.1016/j.bcp.2008.03.019. Epub 2008 Apr 6.

Specificity, affinity and efficacy of iota-conotoxin RXIA, an agonist of voltage-gated sodium channels Na(V)1.2, 1.6 and 1.7

Affiliations

Specificity, affinity and efficacy of iota-conotoxin RXIA, an agonist of voltage-gated sodium channels Na(V)1.2, 1.6 and 1.7

Brian Fiedler et al. Biochem Pharmacol. .

Abstract

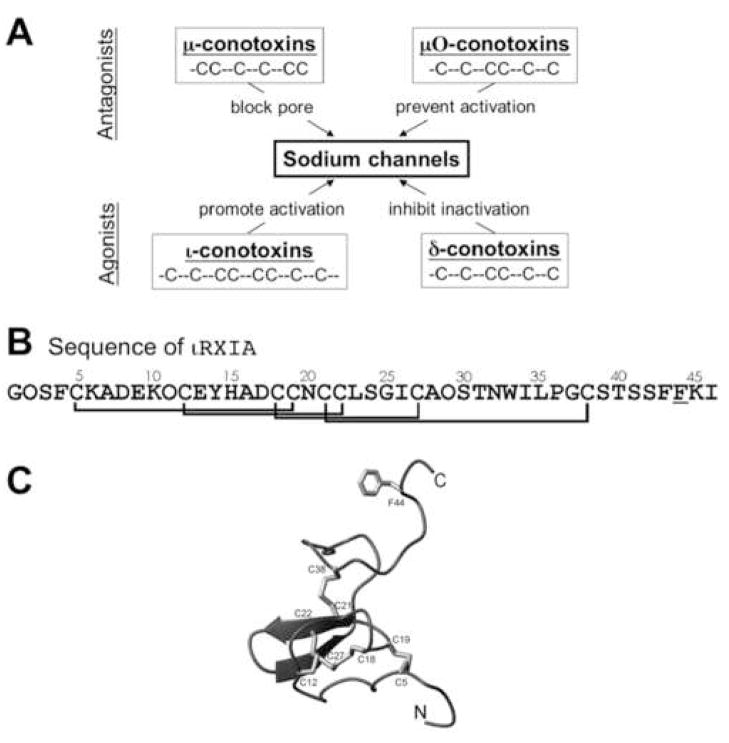
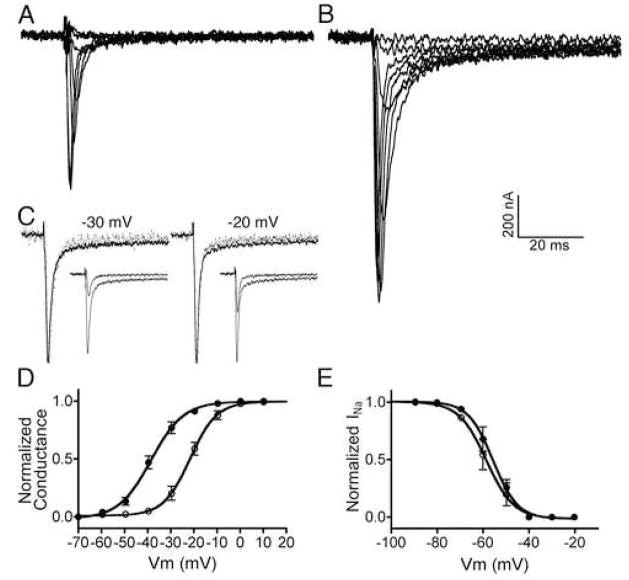
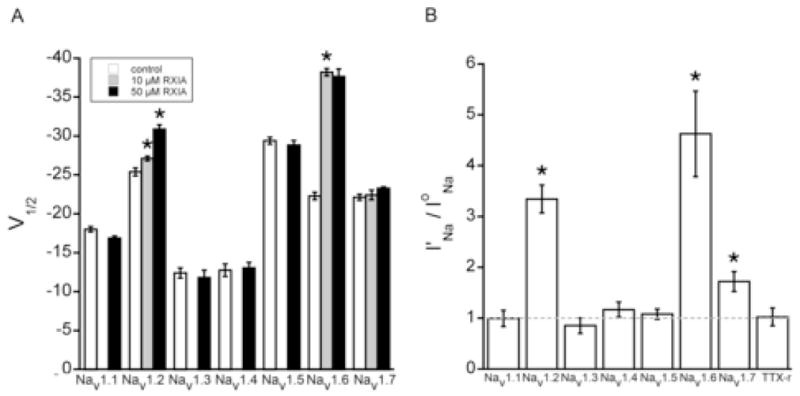
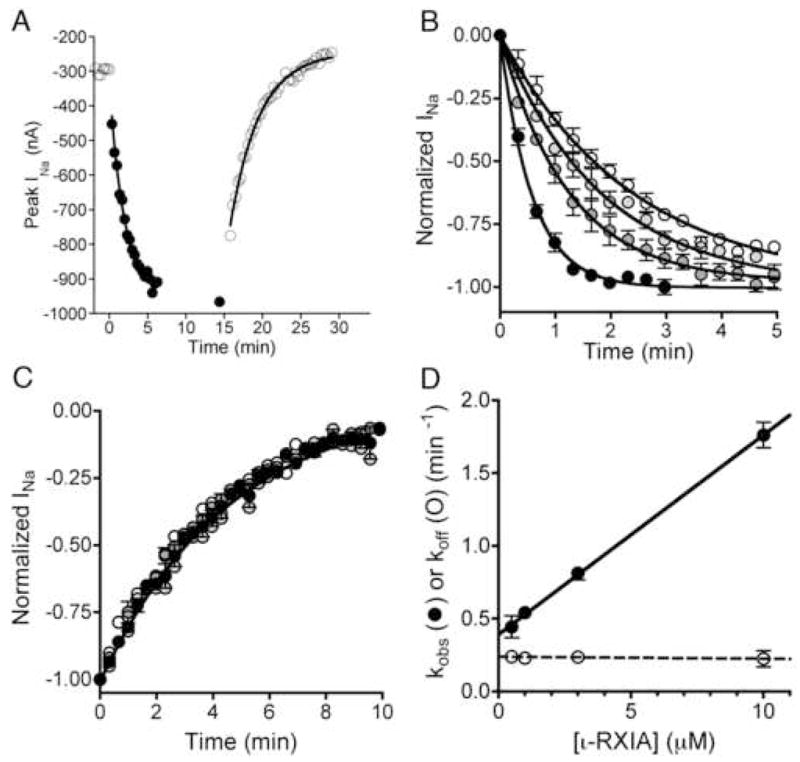
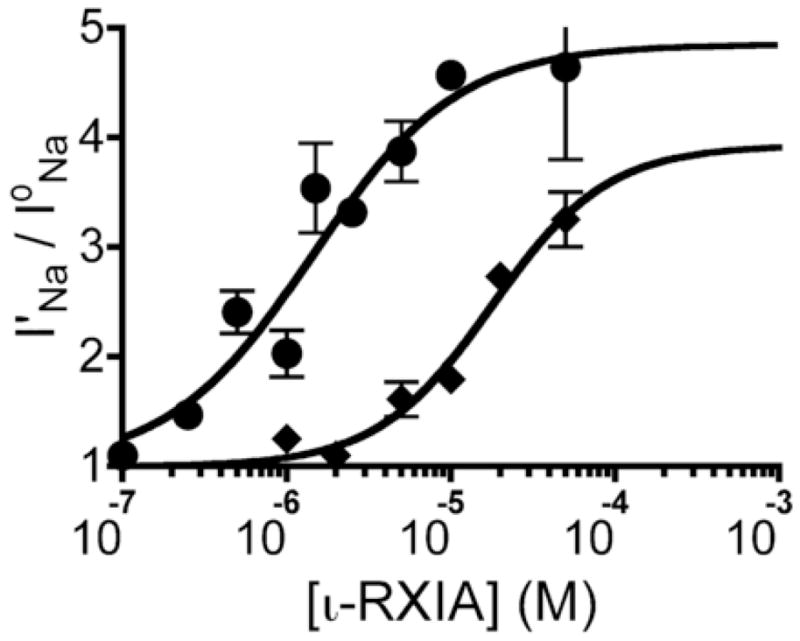
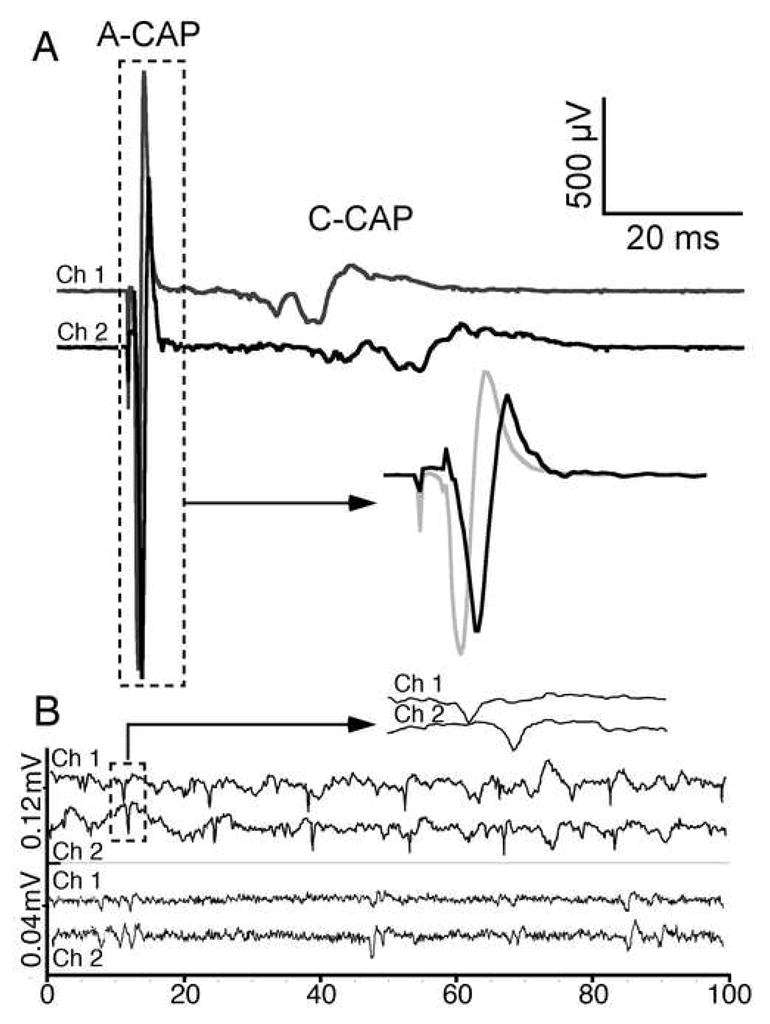
The excitotoxic conopeptide iota-RXIA induces repetitive action potentials in frog motor axons and seizures upon intracranial injection into mice. We recently discovered that iota-RXIA shifts the voltage-dependence of activation of voltage-gated sodium channel Na(V)1.6 to a more hyperpolarized level. Here, we performed voltage-clamp experiments to examine its activity against rodent Na(V)1.1 through Na(V)1.7 co-expressed with the beta1 subunit in Xenopus oocytes and Na(V)1.8 in dissociated mouse DRG neurons. The order of sensitivity to iota-RXIA was Na(V)1.6 > 1.2 > 1.7, and the remaining subtypes were insensitive. The time course of iota-RXIA-activity on Na(V)1.6 during exposure to different peptide concentrations were well fit by single-exponential curves that provided k(obs). The plot of k(obs)versus [iota-RXIA] was linear, consistent with a bimolecular reaction with a K(d) of approximately 3 microM, close to the steady-state EC(50) of approximately 2 microM. iota-RXIA has an unusual residue, D-Phe, and the analog with an L-Phe instead, iota-RXIA[L-Phe44], had a two-fold lower affinity and two-fold faster off-rate than iota-RXIA on Na(V)1.6 and furthermore was inactive on Na(V)1.2. iota-RXIA induced repetitive action potentials in mouse sciatic nerve with conduction velocities of both A- and C-fibers, consistent with the presence of Na(V)1.6 at nodes of Ranvier as well as in unmyelinated axons. Sixteen peptides homologous to iota-RXIA have been identified from a single species of Conus, so these peptides represent a rich family of novel sodium channel-targeting ligands.


Figures

Figure 1
Figure 1
A, Four families of peptide conotoxins that target Na channels. Members in the upper two, μ- and μO-conotoxins, inhibit Na channels, whereas those in the lower two, ι- and δ-conotoxins, are agonist. The cysteine framework of each peptide family is illustrated. All cysteines are disulfide-bonded, rendering each peptide into a compact structure. B, The sequence of ι-RXIA, the iota-conotoxin studied in this report, where O is hydroxyproline, and the underlined F (residue 44) is the D-enantiomer of phenylalanine. The synthetic homologue, ι-RXIA[L-Phe44], is identical to ι-RXIA except residue 44 is an L-phenylalanine. The disulfide bridges between Cys residues are indicated. C, Ribbon structure of ι-RXIA determined by NMR spectroscopy [20]. Locations of the Cys residues and their disulfide linkages are indicated; also shown is the side chain of D-Phe44. This figure was prepared using PyMol (http://www.pymol.org).
Figure 2
Figure 2
ι-RXIA modulates the activity of NaV1.6 coexpressed with β1 in Xenopus oocytes by shifting its voltage-dependence of activation. Oocytes were two-electrode clamped at a holding potential of −100 mV, and Vm was stepped in 10 mV increments as described in Methods. Representative current records for voltage steps ranging from −60 to 10 mV in the absence (A) and presence (B) of 10 μM ι-RXIA. C, Normalized current traces from A and B in response to the voltage step to −30 mV (left) and −20 mV (right), in the absence (dots) and presence (solid line) of 10 μM ι-RXIA; each pair of responses to a given voltage step largely overlap. Insets show corresponding traces non-normalized. Voltage sensitivity of activation (D) and inactivation (E) obtained in the absence (open circles) and presence (closed circles) of ι-RXIA. The solid lines are best-fit curves to the Boltzmann equation. V1/2 values for activation in D were −22.38 ± 0.48 (control) and −38.29 ± 0.47 mV (10 μM ι-RXIA) with respective slope factors of −6.08 ± 0.42 and −7.53 ± 0.41 mV. V1/2 values for inactivation in E were −58.71 ± 1.03 (control) and −55.73 ± 0.75 mV (5 μM ι-RXIA) with respective slope factors of 5.98 ± 0.90 and 5.37 ± 0.61 mV. Each data point represents mean ± SE (N = 3 oocytes).
Figure 3
Figure 3
Effect of ι-RXIA on NaV1.1 through NaV1.7 coexpressed with β1 in Xenopus oocytes and TTX-resistant Na channels in dissociated neurons from mouse DRG. Oocytes were used as in Fig. 2, and neurons were whole-cell clamped and TTX-resistant INa were recorded as described in Methods. A, V1/2 of the voltage-dependence of activation in controls (white bars) and in the presence of 10 μM (gray bars) or 50 μM (black bars) ι-RXIA. In 10 μM ι-RXIA, V1/2‘s of only NaV1.2/β1 and 1.6/β1 differed significantly from control. In 50 μM ι-RXIA, V1/2 of NaV1.6/β1 remained unchanged, that of NaV1.2/β1 changed further, and those of NaV1.1/β1, 1.3/β1, 1.4/β1, 1.5/β1, and 1.7/β1 remained insignificantly different from controls. B, Ratio of I′Na/IoNa for Vstep to −30 mV, where I′Na and IoNa are peak INa in 50 μM ι-RXIA and control, respectively. The ratio measurement shows that in addition to NaV1.2/β1 and 1.6/β1, NaV1.7/β1 was also significantly up-modulated by 50 μM ι-RXIA. I′Na/IoNa value of none of the other Na channels differed significantly from 1, indicating they were not affected even at this high toxin concentration. Bars represent mean ± SE (N = 3). *p < .05, compared to bar immediately to its left (A) or compared to value of 1 (B).
Figure 4
Figure 4
Kinetics of the modulation of NaV1.6/β1 by ι-RXIA. Oocytes were used essentially as described in Fig. 2, and the peak INa in response to a Vstep to −30 mV from a holding potential of −100 mV was measured at different times during the exposure to and washout of ι-RXIA. A, Representative time course of INa during exposure to 3 μM ι-RXIA (closed circles) and its subsequent washout (open circles). Absence of points for 5 min in middle of plot reflects period when I-V data were being acquired. Single-exponential best-fits of the data provided kobs (the observed rate constant for the toxin-induced increase in INa) and koff (the rate constant of recovery following washout). Values of kobs and koff for illustrated curves were 0.65 min−1 and 0.24 min−1, respectively. B, Time course of normalized peak INa upon exposure to 0.5, 1, 3, and 10 μM ι-RXIA (from white to progressively darker circles, respectively). C, Time course of normalized peak INa following washout of ι-RXIA (symbols as in B). The data points largely overlap, and the best fit single-exponential curve for all of them is shown, yielding an aggregate koff of 0.227 ± 0.007. D, Plot of kobs (closed circles) and koff (open circles) versus [ι-RXIA], from data shown in B and C, respectively. Values for kobs increased linearly with peptide concentration, best-fit linear regression line (solid curve) has slope of 0.137 ± 0.002 μM−1•min−1 and Y-intercept of 0.394 ± 0.011 min−1. In contrast, koff values remained invariant, with average value of 0.229 ± 0.021 min−1. Each data point represents mean ± S.E. (N = 3 oocytes).
Figure 5
Figure 5
Modulation NaV1.6/β1 and 1.2/β1 as a function of ι-RXIA concentration at steady-state. Current measurements in response to a Vstep to −30 mV were made as in Fig. 4, and modulation is expressed as a ratio of peak currents, I′Na/IoNa, where I′Na and IoNa were obtained in toxin and control solution, respectively. Effect of ι-RXIA on NaV1.6/β1 (circles) and NaV1.2/β1 (diamonds) measured at steady-state, solid line represents data fit to the equation, Y = (Top −1)/(1 + 10^((LogEC50 − Log[ι-RXIA]) × nH)), where nH is the Hill coefficient. Respective EC50 values for NaV1.6/β1 and 1.2/β1 were 1.80 μM (95% CI: 0.93 –3.60 μM) and 17.78 μM (95% CI: 4.70 – 67.21 μM) and nH values were 1.04 ± 0.26 and 1.24 ± 0.44. Each point represents mean ± S.E. (N = 3 oocytes).
Figure 6
Figure 6
Comparison of the modulation of NaV1.6/β1 and NaV1.2/β1 by ι-RXIA[L-Phe44] and ι-RXIA. Oocytes were tested essentially as described in Figs. 2, 3, and 4. A, Voltage dependence of activation of NaV1.6/β1 in the absence (open squares) and presence of 50 μM ι-RXIA[L-Phe44] (closed squares); respective V1/2 was −21.66 ± 0. 61 and −25.30 ± 0.27 mV and slope factor was 5.75 ± 0.54 and 5.58 ± 0.23 mV. For comparison, the curve for ι-RXIA from Fig. 2D is shown in gray. B, Plot of kobs vs. concentration of ι-RXIA[L-Phe44] for NaV1.6/β1 (black squares). Slope (or kon) was 0.152 ± 0.008 μM−1•min−1, and Y intercept (or extrapolated koff) was 0.841 ± 0.145 min-1, yielding a Kd of 5.52 μM. For comparison, the curve for ι-RXIA (from Fig. 4D) is shown in gray. C, Modulation of NaV1.6/β1 as a function of ι-RXIA[L-Phe44] concentration (black squares). EC50 was 5.45 μM (95% CI: 2.03 – 14.63 μM) and nH was 1.13 ± 0.39. For comparison, the curve for ι-RXIA (from Fig. 5) is shown in gray; note that at or near saturating [peptide] its efficacy is about twice that of ι-RXIA[L-Phe44]. D, Modulation of NaV1.2/β1 as a function of ι-RXIA[L-Phe44] concentration (black triangles) yields a flat line, showing that the peptide had no effect on NaV1.2/β1. For comparison, the curve for ι-RXIA (from Fig. 5) is shown in gray.
Figure 7
Figure 7
ι-RXIA induces action potentials in A- and C-fibers in mouse sciatic nerve. Extracellular action potentials were recorded simultaneously from two locations along the nerve as described in Methods, 7 mm apart. In each pair of traces, the upper (Channel 1) and lower (Channel 2) traces were recorded from a proximal versus distal location, respectively, relative to the site of electrical stimulus (A) or toxin-application (B). A, Stimulus-evoked compound action potentials (CAPs) in control solution showing fast A-CAP with conduction velocity of 11.8 m/s, and slower C-CAP with conduction velocity in the range of 0.72 to 0.48 m/s. Region of A-CAPs enclosed by (10 ms wide) dashed box is shown in inset with baselines superimposed and reveals a ~ 0.6 ms temporal offset; note 1 ms stimulus artifact near start of traces. B, “Spontaneous” action potentials induced by exposure to 0.05 μM ι-RXIA; representative recordings of single-units with conduction velocities of about 10 (top pair) and 0.7 (bottom pair) m/s. Region of top pair of traces enclosed by (5 ms wide) dashed box is shown in inset, revealing a ~ 0.7 ms temporal offset of this unit corresponding to that of an A-fiber. Lower trace in bottom pair of traces has been shifted leftward by 9.5 ms and reveals near coincidence of units corresponding to those of C-fibers.

References

    1. Gonzalez-Burgos G, Barrionuevo G. Voltage-gated sodium channels shape subthreshold EPSPs in layer 5 pyramidal neurons from rat prefrontal cortex. J Neurophysiol. 2001;86:1671–84. - PubMed
    1. Sontheimer H, Black JA, Waxman SG. Voltage-gated Na+ channels in glia: properties and possible functions. Trends Neurosci. 1996;19:325–31. - PubMed
    1. Catterall WA, Goldin AL, Waxman SG. International Union of Pharmacology. XLVII. Nomenclature and structure-function relationships of voltage-gated sodium channels. Pharmacol Rev. 2005;57:397–409. - PubMed
    1. Cestele S, Catterall WA. Molecular mechanisms of neurotoxin action on voltage-gated sodium channels. Biochimie. 2000;82:883–92. - PubMed
    1. Norton RS, Olivera BM. Conotoxins down under. Toxicon. 2006;48:780–98. - PubMed

Publication types

MeSH terms