. 2008 Dec;44(6):567-79.
doi: 10.1016/j.ceca.2008.04.001. Epub 2008 May 16.

Purinergic-mediated Ca2+ influx in Dictyostelium discoideum

Affiliations

Purinergic-mediated Ca2+ influx in Dictyostelium discoideum

Melanie J Ludlow et al. Cell Calcium. 2008 Dec.

Abstract

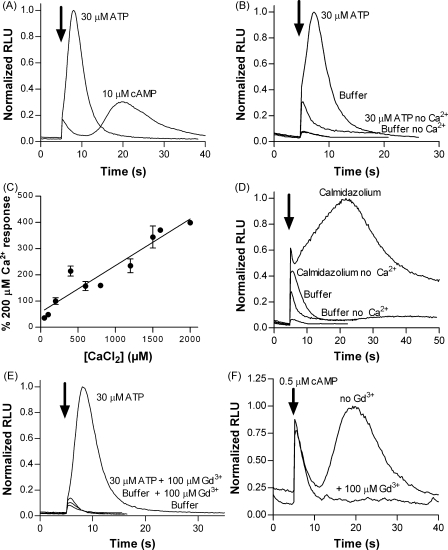
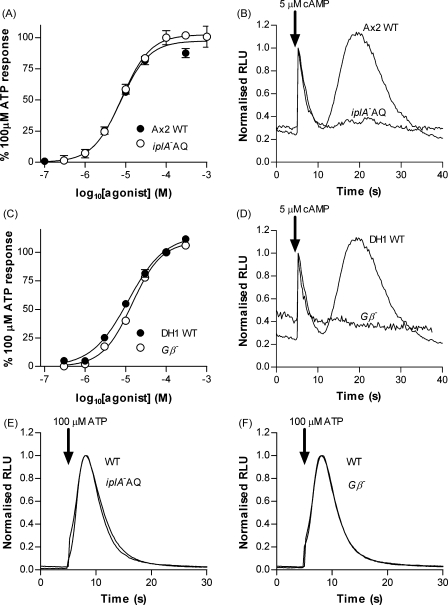
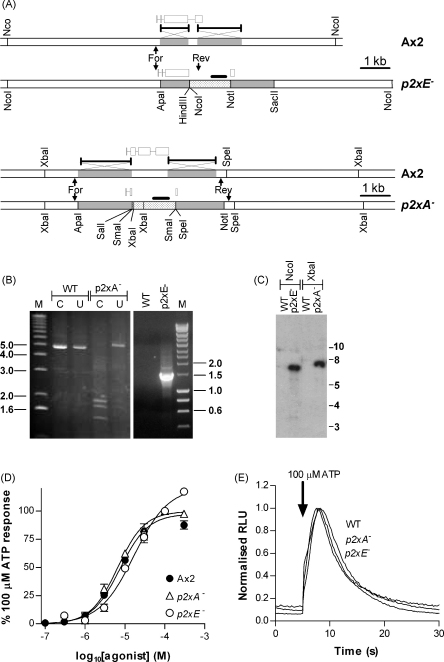
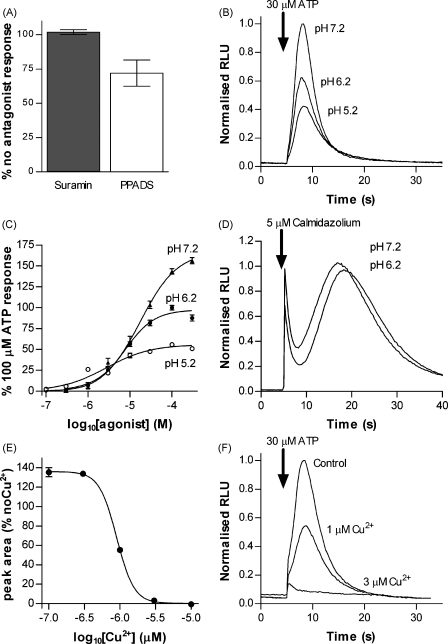
The presence of five P2X-like genes (p2xA-E) in Dictyostelium suggests that nucleotides other than cAMP may act as extracellular signalling molecules in this model eukaryote. However, p2xA was found to have an exclusively intracellular localisation making it unclear whether Dictyostelium utilise P2 receptors in a manner analogous to vertebrates. Using an apoaequorin expressing strain we show here that Dictyostelium do possess cell surface P2 receptors that facilitate Ca(2+) influx in response to extracellular ATP and ADP (EC(50)=7.5microM and 6.1microM, respectively). Indicative of P2X receptor activation, responses were rapid reaching peak within 2.91+/-0.04s, required extracellular Ca(2+), were inhibited by Gd(3+), modified by extracellular pH and were not affected by deletion of either the single Gbeta or iplA genes. Responses also remained unaffected by disruption of p2xA or p2xE showing that these genes are not involved. Cu(2+) and Zn(2+) inhibited purine-evoked Ca(2+) influx with IC(50) values of 0.9 and 6.3microM, respectively. 300microM Zn(2+) completely abolished the initial large rapid rise in intracellular Ca(2+) revealing the presence of an additional smaller, slower P2Y-like response. The existence of P2 receptors in Dictyostelium makes this organism a valuable model to explore fundamental aspects of purinergic signalling.


Figures

Figure 1
Figure 1
Measurement of ATP responses in apoaequorin expressing Dictyostelium. Apoaequorin expressing Ax2 (strain HPF275 [18]) cells were incubated with the cofactor benzyl coelenterazine in HL-5 media (vegetative cells; 1 × 107 cells/ml) to reconstitute functional aequorin, transferred to MES–DB buffer (3.3 × 106 (A and B) or 2.2 × 106 (C and E) cells/ml) and responses to ATP or buffer were monitored using a luminometer. Traces are normalised to the 30 μM ATP response in each batch of cells. Arrows indicate time of agonist application (5 and 25 s). (A) Profile of luminescence in response to injection of 30 μM ATP and buffer (mechanosensitive response). (B) Desensitisation of response with two sequential injections of 30 μM ATP, 3 μM ATP and buffer (mechanosensitive response) at a 20 s interval. (C) Determination of ATP concentration required to desensitise responses. Following a 10 min preincubation with ATP at the indicated concentration or buffer (control), the response to 30 μM ATP was measured. (D) Assessment of ectonucleotidase activity by measurement of phosphate liberated from ATP/ADP hydrolysis by Dictyostelium (Ax2) (1 × 106 cells/ml) or grade III apyrase (positive control, 20 min incubation). Values are expressed as phosphate liberated as a percentage of initial ATP/ADP concentration (500 μM) (mean ± S.E.M., n = 6). (E) Effect of 10 min preincubation with 3 μM ATP or buffer (control) on the magnitude of response to 30 μM ATP and 5 μM calmidazolium. Preincubation with ATP results in desensitisation of subsequent ATP responses but does not affect the calmidazolium response showing that aequorin depletion is not a factor in the desensitisation of ATP responses (mean ± S.E.M., n = 5). (F) In order to show that that the force of agonist injection does not cause ATP release from the cells, changes in extracellular ATP concentration were measured using a luciferase–luciferin ATP bioluminescent assay kit following injection of 150 μl buffer into 1.5 ml cells (3.3 × 106 cells/ml in MES–DB), buffer injected into buffer (negative control) or 550 nM ATP injected into buffer (positive control). The mean of four independent experiments ± S.E.M. is shown.
Figure 2
Figure 2
ADP and ATP are equipotent in eliciting an intracellular Ca2+ response. Responses to extracellular nucleotides were measured in vegetative aequorin-expressing Ax2 cells (3.3 × 106 cells/ml). Arrows indicate time of injection (5 and 25 s). (A) Response to 100 μM ADP, AMP, adenosine, αβ-me-ATP, BzATP, 2-MeSATP, UTP and UDP, relative to 100 μM ATP (mean ± S.E.M., n = 5). (B) Representative traces showing concentration dependent response to ATP. (C) Concentration response curves for ATP and ADP. Data are normalised to the response to 100 μM ATP (mean ± S.E.M., n ≥ 5 from at least two independent experiments). (D) Cross desensitisation between ADP and ATP responses. 100 μM ATP was applied 20 s after 100 μM ADP.
Figure 3
Figure 3
The purinergic response has faster kinetics than responses to cAMP, requires extracellular Ca2+ and is inhibited by Gd3+. (A) Cells were made aggregation competent by incubation in MES–DB buffer for 7 h and a direct comparison of responses to 30 μM ATP and 10 μM cAMP made. Traces are normalised to the 30 μM ATP response. Arrow indicates time of agonist injection (5 s). (B) Decreased magnitude of ATP responses in the absence of extracellular Ca2+ in vegetative cells. Responses to 30 μM ATP and buffer (mechanosensitive response) are shown for vegetative cells suspended in MES–DB buffer containing 0 μM (nominally calcium-free) or 250 μM Ca2+. (C) Magnitude of responses to 30 μM ATP with varying concentrations of extracellular CaCl2 in vegetative cells. Data are normalised to the response in 200 μM CaCl2 (mean ± S.E.M., n = 4 from three independent experiments). (D) Response of vegetative cells to 5 μM calmidazolium in MES–DB buffer containing 0 μM (nominally calcium-free) or 250 μM, CaCl2. Note that the initial rapid response to calmidazolium remains in the absence of extracellular Ca2+ confirming that aequorin is still capable of detecting rises in intracellular Ca2+ when extracellular Ca2+ is removed. (E) Inhibition of the response to 30 μM ATP in vegetative cells by gadolinium ions (100 μM). (F) Inhibition of the response to 0.5 μM cAMP in aggregation competent cells by 100 μM gadolinium ions. Traces are normalised to the maximum peak value. Arrows indicate time of injection (5 s).
Figure 4
Figure 4
The purinergic response does not require the iplA or genes. (A) Concentration response curves for ATP in vegetative Ax2 and iplAAQ strains. Data are normalised to 100 μM ATP for each strain (mean ± S.E.M., n ≥ 5 from two independent experiments). (B) Response to 5 μM cAMP in Ax2 and iplAAQ aggregation competent cells. Similar to the parent strain iplA, iplAAQ does not exhibit a Ca2+ response to cAMP. Traces are normalised to the peak of the mechanosensitive response (first peak) in each strain. (C) Concentration response curves for ATP in vegetative DH1 and strains. Data are normalised to 100 μM ATP for each strain (mean ± S.E.M., n ≥ 5 from two independent experiments). (D) Loss of response to 5 μM cAMP in AQ cells. Traces are normalised to the peak of the mechanosensitive response for each strain. (E and F) Representative responses to 100 μM ATP in vegetative iplAAQ (E) and AQ (F) cells compared to wild type. The kinetics of the ATP response is unaffected by deletion of either gene. Traces are normalised to the peak response for each strain.
Figure 5
Figure 5
Disruption of the p2xA and p2xE genes by homologous recombination. (A) Homologous recombination strategy for disruption of the p2xA and p2xE genes. Generation of the p2xA strain left 190 bp of 5′ and 56 bp of 3′ coding sequence flanking the blasticidin S transferase cassette (bsr) (dotted bar). For p2xE 314 bp between intron 3 and exon 4 were replaced by bsr. (B) PCR screening of genomic DNA for blasticidin S resistant transformants; primer binding sites indicated by arrows in A. For p2xA an increase in size from 4947 to 5260 bp of the uncut (U) PCR amplicon and the presence of SmaI restriction sites (C), located within bsr, to produce bands of 1974, 1812 and 1474 bp are indicative of targeted insertion. For p2xE the introduction of a reverse primer binding site within bsr is indicative of targeted insertion. (D) NcoI (p2xE) and XbaI (p2xA) digested genomic DNA (10 μg) was hybridised with α-[32P]-dCTP labelled XhoI–EcoRV cut bsr probe (solid bars in A). Single bands of the expected size (7595 and 7028 bp) for p2xA and p2xE respectively, with no hybridisation to WT DNA, confirm a single site of insertion. (D) Concentration response curves for ATP for WT (Ax2), p2xA and p2xE strains. Data are normalised to 100 μM ATP for each strain (mean ± S.E.M., n ≥ 5 from two independent experiments). (E) Representative responses to ATP (100 μM) for p2xA and p2xE strains. The kinetics of the response to ATP is unaffected by deletion of either gene.
Figure 6
Figure 6
Pharmacological properties (A) response to 30 μM ATP in the presence of the P2 receptor antagonists suramin (100 μM) and PPADS (10 μM). Data are presented as mean ± S.E.M. (n = 5). Suramin does not antagonise the response to ATP. Note, the reduction in response in the presence of PPADS is likely due to absorbance of aequorin luminescence by PPADS (see Results). (B) Representative traces demonstrating the effects of extracellular pH on responses to 30 μM ATP. (C) Concentration response curves for ATP-induced responses recorded in extracellular buffer of pH 5.2, 6.2 and 7.2, data are normalised to 100 μM ATP at pH 6.2 (mean ± S.E.M., n ≥ 5 from at least two experiments). (D) Response to 5 μM calmidazolium is unchanged at pH 7.2 and 6.2 showing that the function of aequorin was unaffected. (E) Concentration dependent reduction in 30 μM ATP response by CuCl2 (mean ± S.E.M., n = 5 from two separate experiments). (F) Representative traces showing inhibition of the ATP response by copper. Traces are normalised to the control peak value.
Figure 7
Figure 7
Inhibition by zinc reveals a smaller slower component to the ATP response. (A) Concentration response curve showing inhibition by extracellular Zn2+ of the response to 30 μM ATP (pIC50 5.20 ± 0.06 (6.27 μM)) (mean ± S.E.M., n = 5 from two separate experiments). (B) Concentration response curves for ATP in the presence of an IC50 concentration of Zn2+ (6.3 μM) (mean ± S.E.M., n ≥ 5). (C) Representative traces showing inhibition of the response to 30 μM ATP by extracellular Zn2+. (D) The residual response to 30 μM ATP in the presence of 300 μM Zn2+ reveals a slower component of the response normally masked by the larger rapid response (expanded from C). Arrows indicate time of injection (5 s).

Similar articles

Cited by

References

    1. Eichinger L., Pachebat J.A., Glockner G. The genome of the social amoeba Dictyostelium discoideum. Nature. 2005;435:43–57. - PMC - PubMed
    1. Prabhu Y., Eichinger L. The Dictyostelium repertoire of seven transmembrane domain receptors. Eur. J. Cell Biol. 2006 - PubMed
    1. Taniura H., Sanada N., Kuramoto N., Yoneda Y. A metabotropic glutamate receptor family gene in Dictyostelium discoideum. J. Biol. Chem. 2006;281:12336–12343. - PubMed
    1. Anjard C., Loomis W.F. GABA induces terminal differentiation of Dictyostelium through a GABAB receptor. Development. 2006;133:2253–2261. - PubMed
    1. Kreppel L., Fey P., Gaudet P. dictyBase: a new Dictyostelium discoideum genome database. Nucleic Acids Res. 2004;32:D332–D333. - PMC - PubMed

Publication types

MeSH terms