

In vivo quantification of subcutaneous and visceral adiposity by micro-computed tomography in a small animal model
- PMID: 18486521
- PMCID: PMC2659633
- DOI: 10.1016/j.medengphy.2008.03.006
In vivo quantification of subcutaneous and visceral adiposity by micro-computed tomography in a small animal model
Abstract
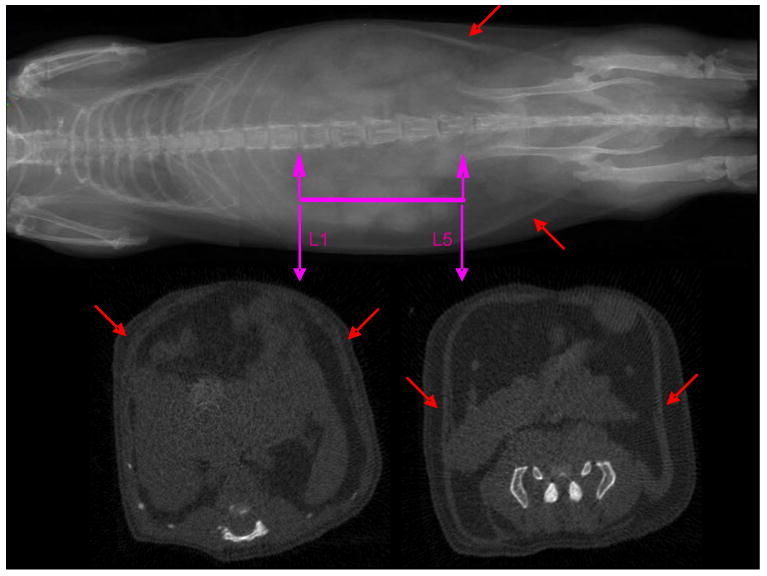
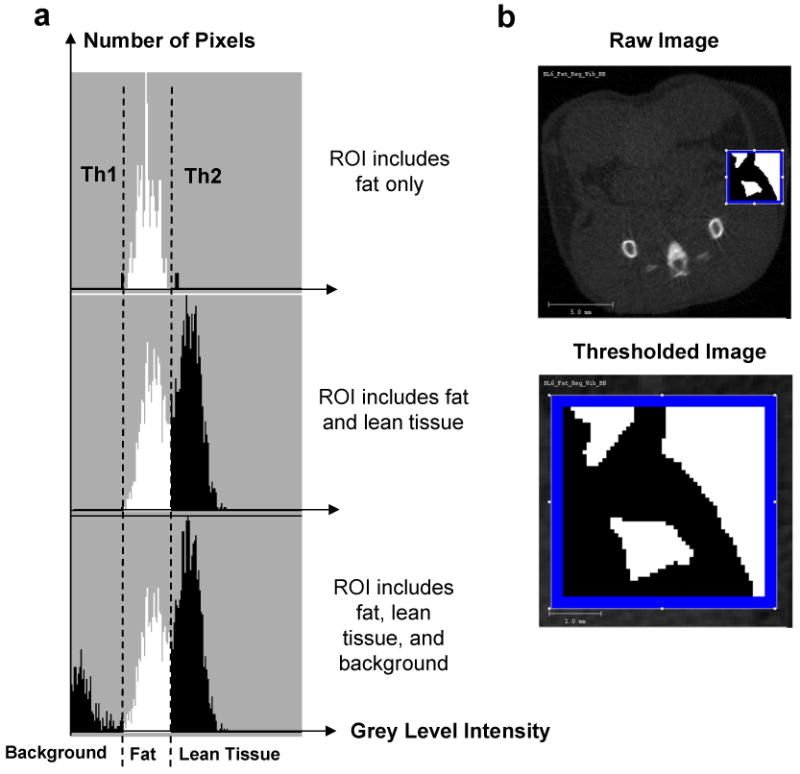
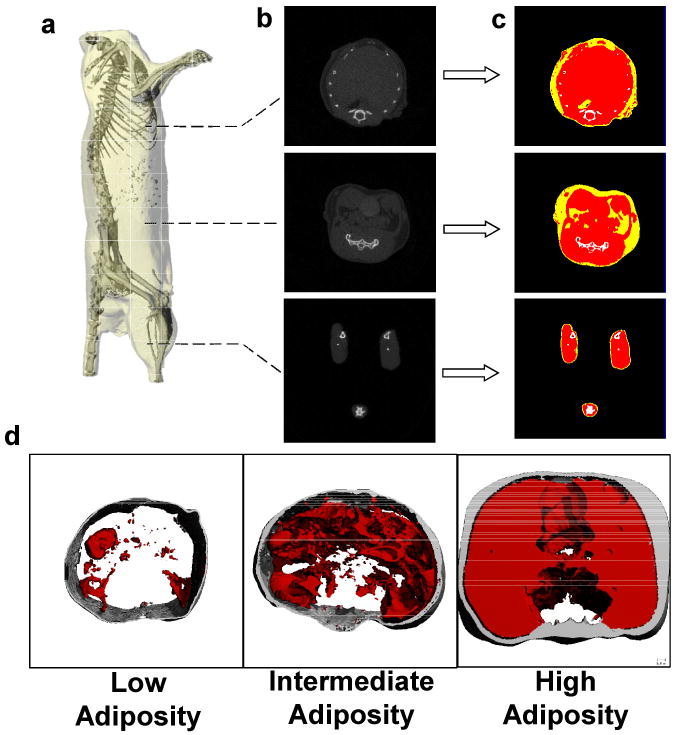
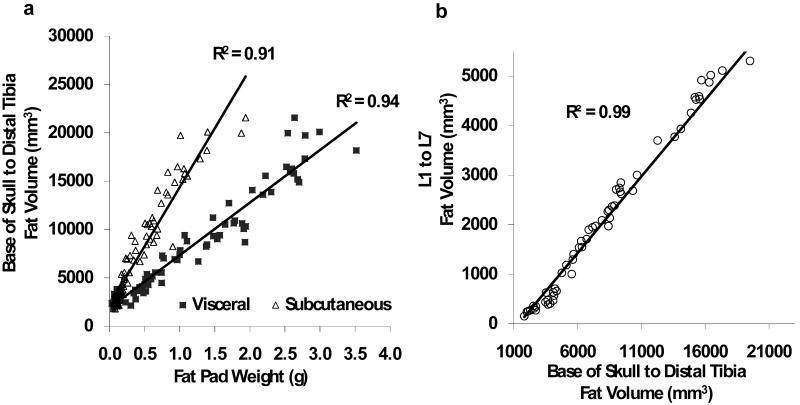
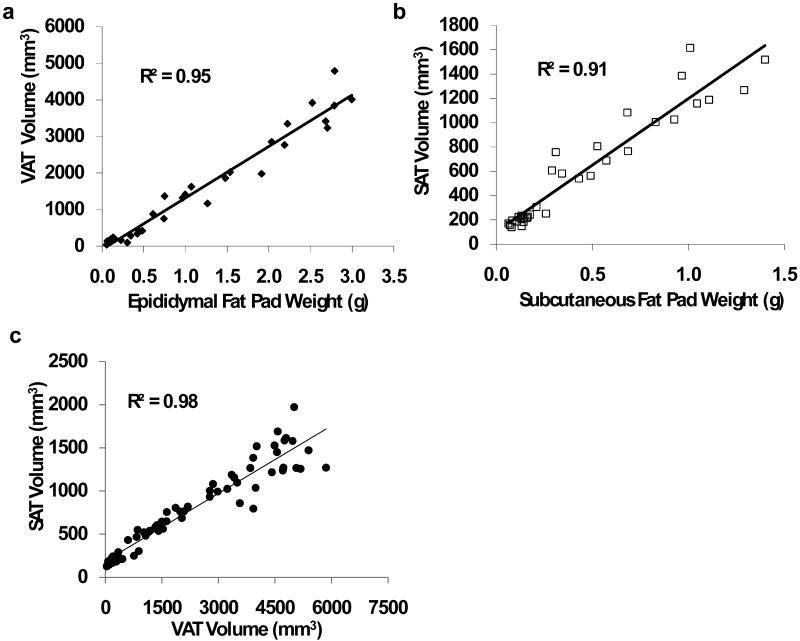
Accurate and precise techniques that identify the quantity and distribution of adipose tissue in vivo are critical for investigations of adipose development, obesity, or diabetes. Here, we tested whether in vivo micro-computed tomography (microCT) can be used to provide information on the distribution of total, subcutaneous and visceral fat volume in the mouse. Ninety C57BL/6J mice (weight range: 15.7-46.5 g) were microCT scanned in vivo at 5 months of age and subsequently sacrificed. Whole body fat volume (base of skull to distal tibia) derived from in vivo microCT was significantly (p<0.001) correlated with the ex vivo tissue weight of discrete perigonadal (R(2)=0.94), and subcutaneous (R(2)=0.91) fat pads. Restricting the analysis of tissue composition to the abdominal mid-section between L1 and L5 lumbar vertebrae did not alter the correlations between total adiposity and explanted fat pad weight. Segmentation allowed for the precise discrimination between visceral and subcutaneous fat as well as the quantification of adipose tissue within specific anatomical regions. Both the correlations between visceral fat pad weight and microCT determined visceral fat volume (R(2)=0.95, p<0.001) as well as subcutaneous fat pad weight and microCT determined subcutaneous fat volume (R(2)=0.91, p<0.001) were excellent. Data from these studies establish in vivo microCT as a non-invasive, quantitative tool that can provide an in vivo surrogate measure of total, visceral, and subcutaneous adiposity during longitudinal studies. Compared to current imaging techniques with similar capabilities, such as microMRI or the combination of DEXA with NMR, it may also be more cost-effective and offer higher spatial resolutions.
Conflict of interest statement
Figures
Similar articles
-
Automated separation of visceral and subcutaneous adiposity in in vivo microcomputed tomographies of mice.J Digit Imaging. 2009 Jun;22(3):222-31. doi: 10.1007/s10278-008-9152-x. Epub 2008 Sep 3. J Digit Imaging. 2009. PMID: 18769966 Free PMC article.
-
Quantification of adiposity in small rodents using micro-CT.Methods. 2010 Jan;50(1):14-9. doi: 10.1016/j.ymeth.2009.05.017. Epub 2009 Jun 10. Methods. 2010. PMID: 19523519 Free PMC article. Review.
-
Visceral adiposity and inflammatory bowel disease.Int J Colorectal Dis. 2021 Nov;36(11):2305-2319. doi: 10.1007/s00384-021-03968-w. Epub 2021 Jun 9. Int J Colorectal Dis. 2021. PMID: 34104989 Review.
-
Abdominal fat analyzed by DEXA scan reflects visceral body fat and improves the phenotype description and the assessment of metabolic risk in mice.Am J Physiol Endocrinol Metab. 2012 Sep 1;303(5):E635-43. doi: 10.1152/ajpendo.00078.2012. Epub 2012 Jul 3. Am J Physiol Endocrinol Metab. 2012. PMID: 22761161 Free PMC article.
-
Metabolic Activity in the Visceral and Subcutaneous Adipose Tissues by FDG-PET/CT in Obese Patients.Acta Med Port. 2017 Nov 29;30(11):813-817. doi: 10.20344/amp.8712. Epub 2017 Nov 29. Acta Med Port. 2017. PMID: 29279074
Cited by
-
Hedgehog signaling in bone regulates whole-body energy metabolism through a bone-adipose endocrine relay mediated by PTHrP and adiponectin.Cell Death Differ. 2017 Feb;24(2):225-237. doi: 10.1038/cdd.2016.113. Epub 2016 Oct 14. Cell Death Differ. 2017. PMID: 27740628 Free PMC article.
-
Incorporating Refractory Period in Mechanical Stimulation Mitigates Obesity-Induced Adipose Tissue Dysfunction in Adult Mice.Obesity (Silver Spring). 2017 Oct;25(10):1745-1753. doi: 10.1002/oby.21958. Epub 2017 Aug 25. Obesity (Silver Spring). 2017. PMID: 28840647 Free PMC article.
-
Mechanical Signals As a Non-Invasive Means to Influence Mesenchymal Stem Cell Fate, Promoting Bone and Suppressing the Fat Phenotype.Bonekey Osteovision. 2009 Apr 1;6(4):132-149. doi: 10.1138/20090371. Bonekey Osteovision. 2009. PMID: 22241295 Free PMC article.
-
Segmentation and measurement of fat volumes in murine obesity models using X-ray computed tomography.J Vis Exp. 2012 Apr 4;(62):e3680. doi: 10.3791/3680. J Vis Exp. 2012. PMID: 22508524 Free PMC article.
-
Synergistic Effects of Heat-Treated Green Tea Extract and Enzymatically-Modified Isoquercitrin in Preventing Obesity.Nutrients. 2023 Jun 28;15(13):2931. doi: 10.3390/nu15132931. Nutrients. 2023. PMID: 37447257 Free PMC article.
References
-
- Bastie CC, Zong H, Xu J, Busa B, Judex S, Kurland IJ, Pessin JE. Integrative metabolic regulation of peripheral tissue fatty acid oxidation by the SRC kinase family member Fyn. Cell Metab. 2007;5:371–381. - PubMed
-
- Brockmann GA, Bevova MR. Using mouse models to dissect the genetics of obesity. Trends Genet. 2002;18:367–376. - PubMed
-
- Buie HR, Campbell GM, Klinck RJ, MacNeil JA, Boyd SK. Automatic segmentation of cortical and trabecular compartments based on a dual threshold technique for in vivo micro-CT bone analysis. Bone. 2007;41:505–515. - PubMed
-
- Calderan L, Marzola P, Nicolato E, Fabene PF, Milanese C, Bernardi P, Giordano A, Cinti S, Sbarbati A. In vivo phenotyping of the ob/ob mouse by magnetic resonance imaging and 1H-magnetic resonance spectroscopy. Obesity (Silver Spring) 2006;14:405–414. - PubMed
-
- Canny J. IEEE Transactions on Pattern Analysis and Machine Intelligence. Vol. 8 1986. A Computational Approach to Edge Detection. - PubMed
Publication types
MeSH terms
Grants and funding
LinkOut - more resources
Full Text Sources
