

Cardiac cycle-dependent left atrial dynamics: implications for catheter ablation of atrial fibrillation
- PMID: 18486563
- PMCID: PMC2527027
- DOI: 10.1016/j.hrthm.2008.03.003
Cardiac cycle-dependent left atrial dynamics: implications for catheter ablation of atrial fibrillation
Abstract
Background: Left atrial (LA) volume determines prognosis and response to therapy for atrial fibrillation. Integration of electroanatomic maps with three-dimensional images rendered from computed tomography and magnetic resonance imaging (MRI) is used to facilitate atrial fibrillation ablation.
Objective: The purpose of this study was to measure LA volume changes and regional motion during the cardiac cycle that might affect the accuracy of image integration and to determine their relationship to standard LA volume measurements.
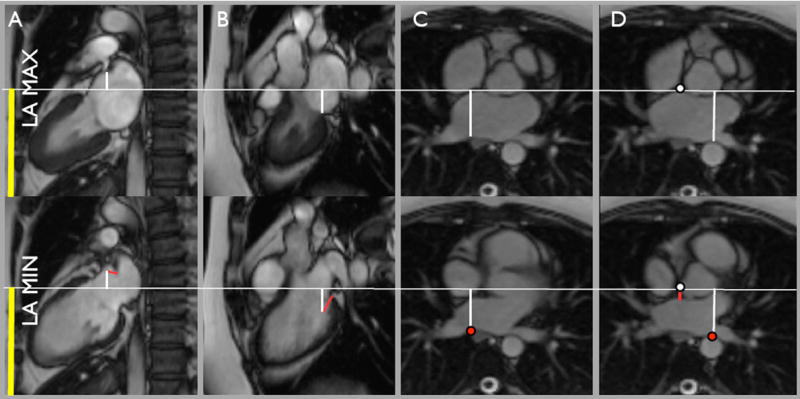
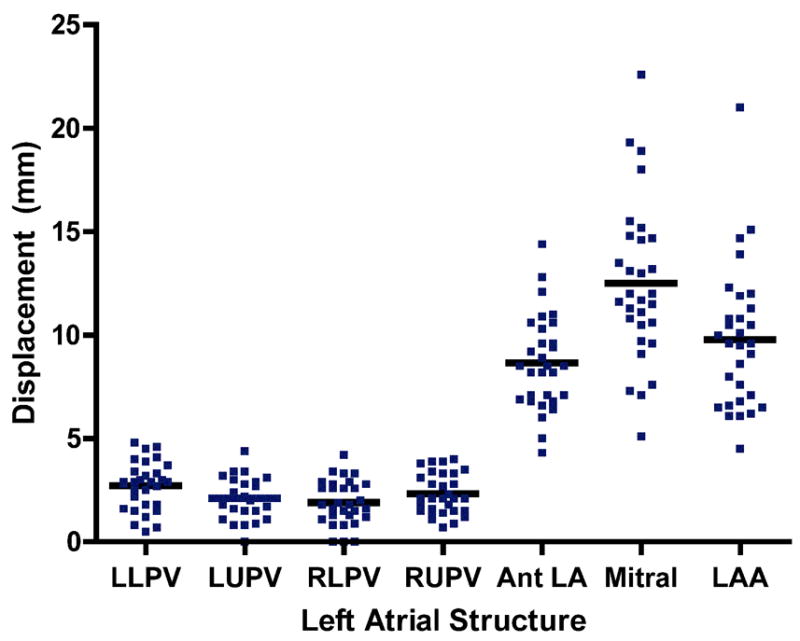
Methods: MRI was performed in 30 patients with paroxysmal atrial fibrillation. LA time-volume curves were generated and used to divide LA ejection fraction into pumping ejection fraction and conduit ejection fraction and to determine maximum LA volume (LA(max)) and preatrial contraction volume. LA volume was measured using an MRI angiogram and traditional geometric models from echocardiography (area-length model and ellipsoid model). In-plane displacement of the pulmonary veins, anterior left atrium, mitral annulus, and LA appendage was measured.
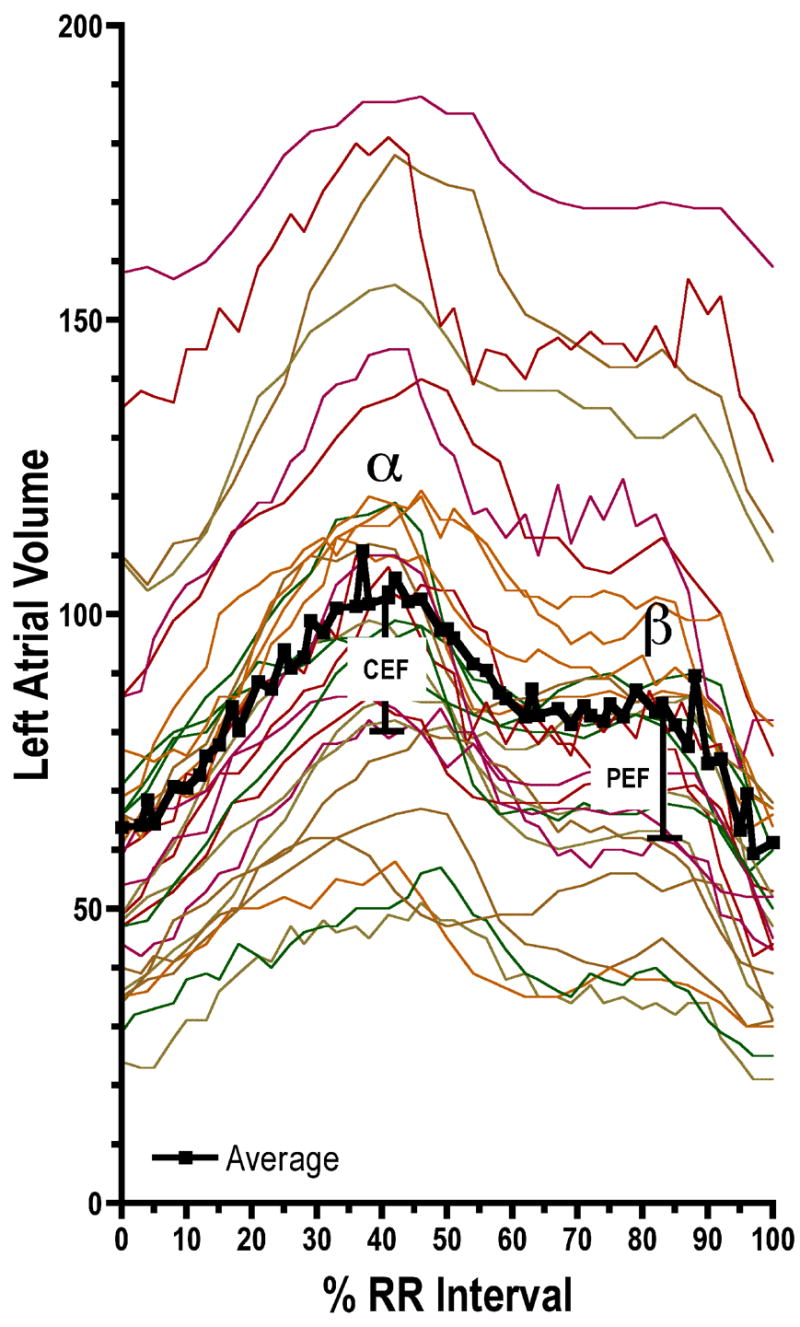
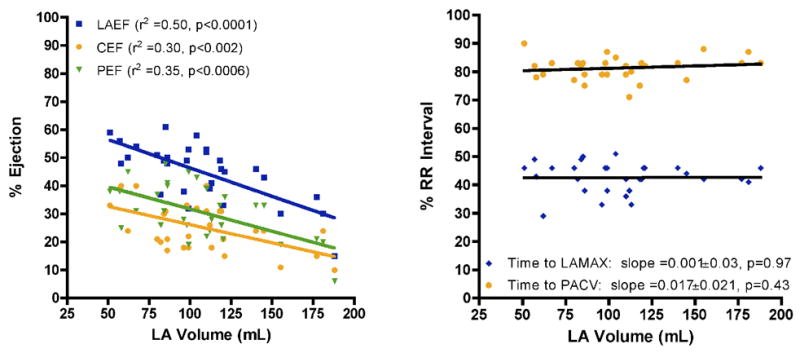
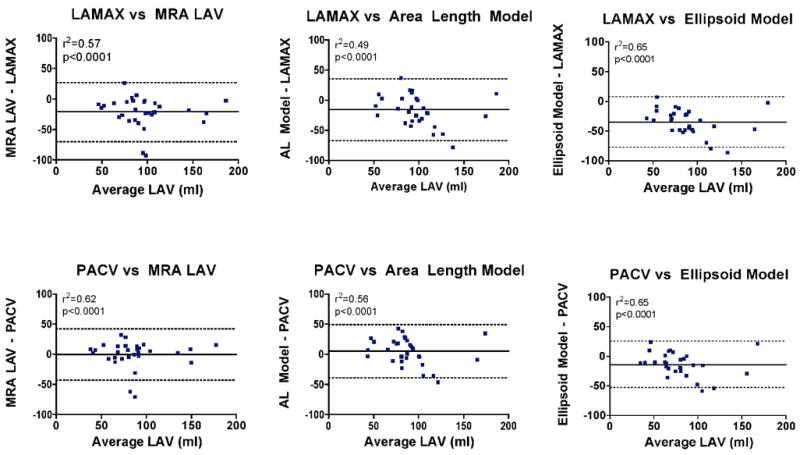
Results: LA(max) was 107 +/- 36 mL and occurred at 42% +/- 5% of the R-R interval. Preatrial contraction volume was 86 +/- 34 mL and occurred at 81% +/- 4% of the R-R interval. LA ejection fraction was 45% +/- 10%, and pumping ejection fraction was 31% +/- 10%. LA volume measurements made from MRI angiogram, area-length model, and ellipsoid model underestimated LA(max) by 21 +/- 25 mL, 16 +/- 26 mL, and 35 +/- 22 mL, respectively. Anterior LA, mitral annulus, and LA appendage were significantly displaced during the cardiac cycle (8.8 +/- 2.0 mm, 13.2 +/- 3.8 mm, and 10.2 +/- 3.4 mm, respectively); the pulmonary veins were not displaced.
Conclusion: LA volume changes significantly during the cardiac cycle, and substantial regional variation in LA motion exists. Standard measurements of LA volume significantly underestimate LA(max) compared to the gold standard measure of three-dimensional volumetrics.
Conflict of interest statement
Disclosures: The authors do not have any conflicts of interest.
Figures
References
-
- Haissaguerre M, Jais P, Shah DC, et al. Electrophysiological end point for catheter ablation of atrial fibrillation initiated from multiple pulmonary venous foci. Circulation. 2000;101:1409–17. - PubMed
-
- Pappone C, Rosanio S, Oreto G, et al. Circumferential radiofrequency ablation of pulmonary vein ostia: A new anatomic approach for curing atrial fibrillation. Circulation. 2000;102:2619–28. - PubMed
-
- Nademanee K, McKenzie J, Kosar E, et al. A new approach for catheter ablation of atrial fibrillation: mapping of the electrophysiologic substrate. J Am Coll Cardiol. 2004;43:2044–53. - PubMed
-
- Kanagaratnam L, Tomassoni G, Schweikert R, et al. Empirical pulmonary vein isolation in patients with chronic atrial fibrillation using a three-dimensional nonfluoroscopic mapping system: long-term follow-up. Pacing Clin Electrophysiol. 2001;24:1774–9. - PubMed
-
- Weiss C, Willems S, Risius T, et al. Functional disconnection of arrhythmogenic pulmonary veins in patients with paroxysmal atrial fibrillation guided by combined electroanatomical (CARTO) and conventional mapping. J Interv Card Electrophysiol. 2002;6:267–75. - PubMed
Publication types
MeSH terms
Grants and funding
LinkOut - more resources
Full Text Sources
Medical
