. 2008 Aug 27;363(1504):2687-703.
doi: 10.1098/rstb.2008.0019.

Evolved physiological responses of phytoplankton to their integrated growth environment

Affiliations

Evolved physiological responses of phytoplankton to their integrated growth environment

Michael J Behrenfeld et al. Philos Trans R Soc Lond B Biol Sci. .

Abstract

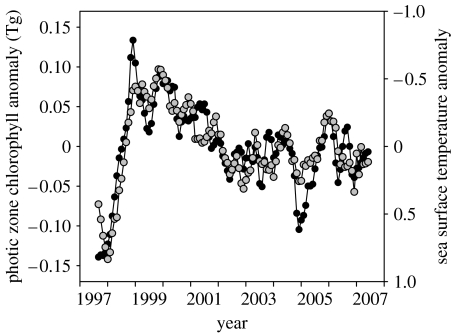
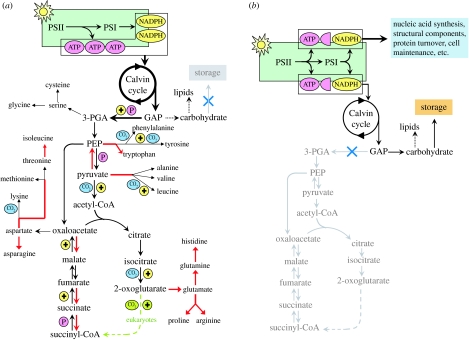
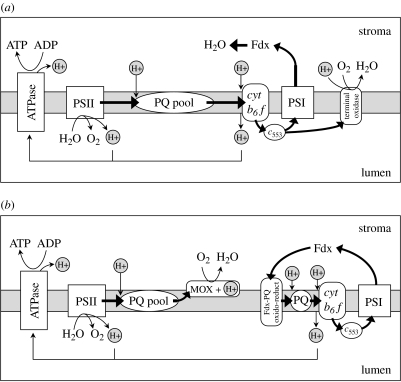
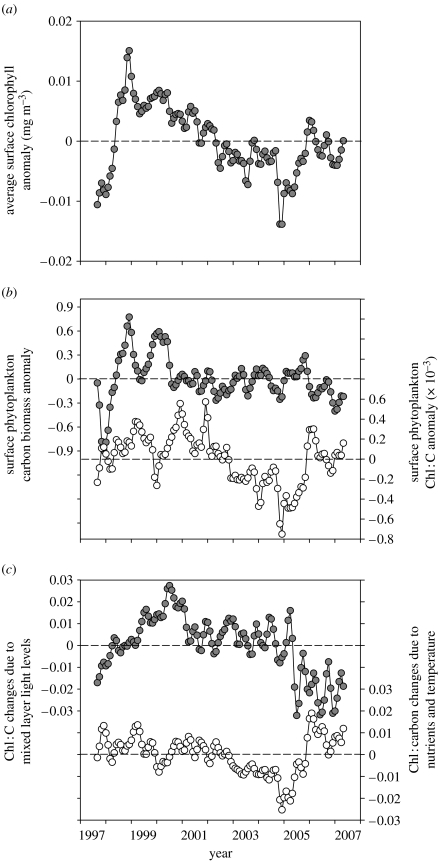
Phytoplankton growth and productivity relies on light, multiple nutrients and temperature. These combined factors constitute the 'integrated growth environment'. Since their emergence in the Archaean ocean, phytoplankton have experienced dramatic shifts in their integrated growth environment and, in response, evolved diverse mechanisms to maximize growth by optimizing the allocation of photosynthetic resources (ATP and NADPH) among all cellular processes. Consequently, co-limitation has become an omnipresent condition in the global ocean. Here we focus on evolved phytoplankton populations of the contemporary ocean and the varied energetic pathways they employ to solve the optimization problem of resource supply and demand. Central to this discussion is the allocation of reductant formed through photosynthesis, which we propose has the following three primary fates: carbon fixation, direct use and ATP generation. Investment of reductant among these three sinks is tied to cell cycle events, differentially influenced by specific forms of nutrient stress, and a strong determinant of relationships between light-harvesting (pigment), photosynthetic electron transport and carbon fixation. Global implications of optimization are illustrated by deconvolving trends in the 10-year global satellite chlorophyll record into contributions from biomass and physiology, thereby providing a unique perspective on the dynamic nature of surface phytoplankton populations and their link to climate.


Figures

Figure 1
Figure 1
SeaWiFS-based monthly anomalies in photic zone chlorophyll for the permanently stratified oceans (average temperature greater than 15°C) between 1997 and 2007 (black circles) and coincident low-latitude SST anomalies (°C; grey circles). See Behrenfeld et al. (2005) for details on data analysis.
Figure 2
Figure 2
Global distributions of (a) annual average total alkalinity as an index of inorganic carbon concentration (data from Key et al. 2004), (b) boreal summer mixed layer dissolved iron (dFe) concentration (data from Moore & Braucher 2007), (c) July surface nitrate (Levitus climatology), (d) July median mixed layer growth irradiance (Ig), (e) July surface phytoplankton carbon (Cphyto) biomass, and (f) July surface phytoplankton growth rates (μ). Data for (d–f) are from http://web.science.oregonstate.edu/ocean.productivity/.
Figure 3
Figure 3
Two basic categories of variability in CI relationships. (a) Ek-dependent behaviour involves uncoupled changes in the light-saturated (Pmax) and light-limited (α) rates of carbon fixation, such that the light-saturation index, Ek, changes. In (b) Ek-independent behaviour, changes in Pmax and α are coupled, such that Ek is constant.
Figure 4
Figure 4
ProMolec results. (a) Diel cycles in incident irradiance (PAR; μmol quanta m−2 s−1; solid line, offset right axis), chlorophyll-specific light-saturated carbon fixation (Pmaxb; mg C mg chl−1 h−1; filled circles, left axis), and the chlorophyll-specific light-limited slope for carbon fixation (αb; mg C m2 s (mg Chl h μmol quanta)−1; open circles, right axis). αb has been corrected for midday photoinhibition effects using variable fluorescence data to demonstrate more clearly the strong correlation in the fraction of light-limited and light-saturated photosynthate used for carbon fixation. (b) Diel carbon fixation rate (fg C cell−1 h−1; filled circles) calculated from CI data and incident light (a) and cellular carbon accumulation rate (fg C cell−1 h−1; open circles). (c) Diel cycles in cellular N:C ratios normalized to the average value measured at midnight (filled circles) and fraction of cells in G1 phase (open circles, right axis). Solid line indicates PAR. Vertical dotted line in each figure demarks period when carbon fixation dropped by greater than 60% (see text).
Figure 5
Figure 5
Comparison of dominant metabolic pathways during (a) amino acid and (b) carbohydrate synthesis. Photosynthesis generates ATP and NADPH (green box). (a) During amino acid synthesis, most of this photosynthate enters the Calvin cycle to produce glyceraldehyde-3-phosphate (GAP), which is the initial substrate for the 20 amino acids. The process generates reductant (yellow circles with ‘+’), ATP (pink circles with ‘P’) and CO2 (blue circles), while some steps also consume ATP and reductant (red arrows). In prokaryotes, the citric acid cycle is incomplete between 2-oxoglutarate and succinyl-CoA (green dashed arrow). Some lipids are also produced during amino acid synthesis but not storage carbohydrates. (b) During carbohydrate synthesis, the glycolytic pathway is downregulated and photosynthate is used directly for other cell activities (blue box). 3-PGA, 3-phosphoglyceric acid; PEP, phosphoenolpyruvate. For simplicity, histidine, which is synthesized from PRPP (5-phosphoribosyl-1-pyrophosphate), ATP and glutamine, is depicted in (a) as deriving from glutamine. PRPP derives from ribose-5-phosphate which is primarily formed by the pentose phosphate pathway. The pentose phosphate pathway is not shown in this figure, but is another important pathway for generating ATP and reductant at the expense of GAP, while releasing CO2.
Figure 6
Figure 6
Thylakoid pathways for enhancing ATP production. (a) Water–water cycles involving the respiratory terminal oxidase in prokaryotes and the Mehler reaction. (b) Decoupled electron flow where electrons from PSII are transferred back to water by a midstream terminal oxidase and electron flow around PSI is cyclic. Proton pumping for ATP generation is accomplished in this scheme through water splitting at PSII and cyclic electron flow around PSI by PQH2 oxidation and Q-cycle pumping at cytochrome b6f.
Figure 7
Figure 7
Change in the surface area : cytoplasm ratio for a cylindrical cell as the vacuole percentage of cell volume increases from 0 to 85% (left axis), and the equivalent diameter of a spherical, non-vacuolated cell with the same surface area : cytoplasm ratio (right axis). As a specific example, the diatom Melosira granulata (inset line drawing) was described by Sicko-Goad et al. (1984) as having an average cell volume of 5130 μm3 (approximate dimensions: 30 μm×15 μm) and a vacuole occupying 70% of the cell, giving a surface area : cytoplasm ratio of approximately 1.1. The diameter of a non-vacuolated spherical cell with an equivalent surface area : cytoplasm ratio is 2.7 μm (top x-axis).
Figure 8
Figure 8
Changes in the atmospheric O2 : CO2 ratio over the Phanerozoic. The peak at 300 Myr ago coincides with the evolution of vascular plants. Horizontal dashed line indicates O2 : CO2 ratio of 100 estimated by von Caemmerer & Furbank (1999) as the selection pressure threshold for developing a CCM. The O2 : CO2 ratios were calculated from Falkowski et al. (2005) and Berner (2006) (see part IV of the electronic supplementary material).
Figure 9
Figure 9
Cellular chlorophyll concentration (pg cell−1; circles) and growth rate (divisions d−1; diamonds) of Dunaliella tertiolecta acclimated to a range of growth irradiance (Ig) levels (μmol quanta m−2 s−1). Dot-dashed line is 1/Ig scaled for comparison with chlorophyll data. Inset is same chlorophyll data as the main figure except with log-log axes to better show deviation between acclimated chlorophyll values and the 1/Ig relationship. Cells were grown under constant light in nutrient-replete (F/2) medium.
Figure 10
Figure 10
(a) Monthly anomalies in surface chlorophyll concentration (mg m−3) for the permanently stratified ocean (greater than 15°C) over the first 10 years of the SeaWiFS record. (b) Monthly anomalies in phytoplankton carbon biomass (mg C m−3; filled circles, left axis) and chlorophyll : carbon (Chl : C) ratios (mg : mg×10−3; open circles, right axis). (c) Monthly anomalies in the relative contribution of photoacclimation (filled circles, left axis) and nutrient-temperature stress (open circles, right axis) to total Chl : C variability. Anomalies were calculated as the difference between a given month's value and the average value for that month for the entire record. Horizontal dashed lines in each figure indicate zero values for each y-axis. Data are based on the GSM satellite algorithm.

References

    1. Asada K. The water–water cycle in chloroplasts: scavenging of active oxygens and dissipation of excess photons. Annu. Rev. Plant Physiol. Plant Mol. Biol. 1999;50:601–639. doi:10.1146/annurev.arplant.50.1.601 - DOI - PubMed
    1. Badger M.R, Price G.D. CO2 concentrating mechanisms in cyanobacteria: molecular components, their diversity and evolution. J. Exp. Bot. 2003;54:609–622. doi:10.1093/jxb/erg076 - DOI - PubMed
    1. Badger M.R, Andrews T.J, Whitney S.M, Ludwig M, Yellowlees D.C, Leggat W, Price G.D. The diversity and coevolution of rubisco, plastids, pyrenoids, and chloroplast-based CO2-concentrating mechanisms in algae. Can. J. Bot. 1998;76:1052–1071. doi:10.1139/cjb-76-6-1052 - DOI
    1. Bailey, S. et al In press. Photosynthesis in marine Synechococcus and the critical nature of electron flow to oxygen. Biochim. Biophys. Acta - PubMed
    1. Behrenfeld M.J, Falkowski P.G. Photosynthetic rates derived from satellite-based chlorophyll concentration. Limnol. Oceanogr. 1997;42:1–20.

Publication types