. 2008 Jul 11;283(28):19265-73.
doi: 10.1074/jbc.M801535200. Epub 2008 May 16.

Complex actions of 2-aminoethyldiphenyl borate on store-operated calcium entry

Affiliations

Complex actions of 2-aminoethyldiphenyl borate on store-operated calcium entry

Wayne I DeHaven et al. J Biol Chem. .

Abstract

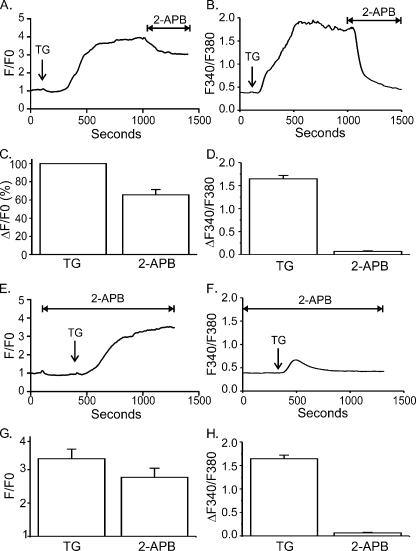
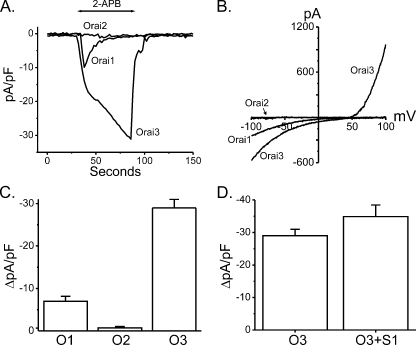
Store-operated Ca2+ entry (SOCE) is likely the most common mode of regulated influx of Ca2+ into cells. However, only a limited number of pharmacological agents have been shown to modulate this process. 2-Aminoethyldiphenyl borate (2-APB) is a widely used experimental tool that activates and then inhibits SOCE and the underlying calcium release-activated Ca2+ current (I CRAC). The mechanism by which depleted stores activates SOCE involves complex cellular movements of an endoplasmic reticulum Ca2+ sensor, STIM1, which redistributes to puncta near the plasma membrane and, in some manner, activates plasma membrane channels comprising Orai1, -2, and -3 subunits. We show here that 2-APB blocks puncta formation of fluorescently tagged STIM1 in HEK293 cells. Accordingly, 2-APB also inhibited SOCE and I(CRAC)-like currents in cells co-expressing STIM1 with the CRAC channel subunit, Orai1, with similar potency. However, 2-APB inhibited STIM1 puncta formation less well in cells co-expressing Orai1, indicating that the inhibitory effects of 2-APB are not solely dependent upon STIM1 reversal. Further, 2-APB only partially inhibited SOCE and current in cells co-expressing STIM1 and Orai2 and activated sustained currents in HEK293 cells expressing Orai3 and STIM1. Interestingly, the Orai3-dependent currents activated by 2-APB showed large outward currents at potentials greater than +50 mV. Finally, Orai3, and to a lesser extent Orai1, could be directly activated by 2-APB, independently of internal Ca2+ stores and STIM1. These data reveal novel and complex actions of 2-APB effects on SOCE that can be attributed to effects on both STIM1 as well as Orai channel subunits.


Figures

FIGURE 1.
FIGURE 1.
2-APB dose-dependently activates and inhibits SOCE in WT HEK293 cells or in cells expressing eYFP-STIM1. A, SOCE was measured in HEK293 cells using the SERCA pump inhibitor, TG (2 μm). TG was applied under nominally Ca2+-free conditions for 15 min to deplete ER Ca2+ stores followed by the addition of 2 mm Ca2+ (5 min) to assess SOCE. After 5 min, different concentrations of 2-APB (0–50 μm) were applied while maintaining the extracellular Ca2+ concentration constant. B, mean SOCE responses above base line from experiments carried out as described in A for 0 μm (DMSO) (n = 3), 3 μm (n = 3), 10 μm (n = 3), 30 μm (n = 3), and 50 μm (n = 3) 2-APB. C, same as A except in HEK293 cells transiently expressing eYFP-STIM1. D, same as in B, except in eYFP-STIM1 cells. (DMSO: n = 3; 3 μm: n = 3; 10 μm: n = 3; 30 μm: n = 4; 50 μm: n = 4). Data are represented as mean ± S.E., and each n represents the mean of a single coverslip containing at least 25 cells.
FIGURE 2.
FIGURE 2.
2-APB reverses near plasma membrane punctate STIM1 localization. A, live eYFP-STIM1-expressing HEK293 cells were imaged by confocal microscopy with replete Ca2+ stores (left) following store depletion with 2 μm TG (middle) and 5 min following treatment with 50 μm 2-APB (right). B, TIRFM measurements were carried out on cells expressing eYFP-STIM1. Shown is an average (4 cells) fluorescence intensity plot from an individual experiment. As indicated, cells were treated with 2 μm TG followed 15 min later by application of 50 μm 2-APB in the continuous presence of 1 mm extracellular Ca2+. C, bar graph showing the percent change in TIRFM fluorescence intensities from three (16 cells total) independent experiments shown in B. To calculate the percent change in fluorescence intensities, the average base line-subtracted TIRFM fluorescence intensity 5 min after 2-APB addition was divided by that just prior to application of 2-APB. D, TIRFM measurements were also carried out in experiments in which cells expressing eYFP-STIM1 were pretreated with 50μm 2-APB for 5 min prior to store depletion with TG. E, the -fold increase in TIRFM fluorescence intensity in response to store depletion with TG was calculated for cells pretreated for 5 min with 50 μm 2-APB and for untreated control cells.
FIGURE 3.
FIGURE 3.
2-APB activates and inhibits ICRAC in HEK293 cells co-expressing STIM1 and Orai1. A, current recording from a HEK293 cell co-expressing eYFP-STIM1 with CFP-Orai1, in which stores were depleted with 20 μm IP3 and 20 mm BAPTA in the pipette. The current was recorded from voltage ramps (–100 to +100 mV) taken every 2 s from a 0 mV holding potential. At 20 μm, 2-APB consistently increased ICRAC in a sustained fashion, whereas 50 μm 2-APB strongly inhibited the currents. Inset, graph shows transient increase followed by near complete block of ICRAC by the focal application of 50 μm 2-APB. B, bar graph of data shown in A represented as the current developed under different 2-APB concentrations (0, 20, 50 μm) minus the leak current, divided by the Ca2+ current (same as 0 μm 2-APB) minus the leak current (ΔIxICa2+). Data are represented as means ± S.E. (20 μm: n = 6; 50 μm: n = 10). C, current-voltage (I-V) relationship from recording shown in A.
FIGURE 4.
FIGURE 4.
Orai1 expression reduces 2-APB inhibition of STIM1 rearrangement. A, TIRFM measurements similar to those described for Fig. 2 were carried out on cells expressing eYFP-STIM1 with CFP-Orai1. 2-APB was added after Ca2+ store depletion with TG. B, single-cell Ca2+ imaging experiment using the same protocol seen in A. TG was added under the presence of 1 mm extracellular Ca2+ followed by the addition of 50 μm 2-APB to assess its effects on SOCE. C, bar graph showing the percent changes in TIRFM fluorescence intensities from three independent experiments (16 cells total) shown in A. D, bar graph showing a near complete block of SOCE by 2-APB in experiments carried out similar to B (n = 4 coverslips). E, TIRFM experiment in HEK293 cells co-expressing eYFP-STIM1 and CFP-Orai1 in which 50 μm 2-APB is added 5 min prior to store depletion with TG. F, experiment similar to that shown in E but using a Ca2+ imaging technique instead of TIRFM. G, bar graph depicting the increase in TIRFM fluorescence intensity in response to store depletion with TG for cells pretreated with 50 μm 2-APB (n = 16 cells from three experiments) and for untreated control cells (n = 18 cells from three experiments). H, bar graph showing the lack of SOCE development in cells pretreated with 2-APB (n = 3 coverslips) compared with untreated controls (n = 4 coverslips). Data are represented as mean ± S.E., and in single-cell Ca2+ imaging experiments each n represents the mean of a single coverslip containing at least 25 cells.
FIGURE 5.
FIGURE 5.
Responses to 2-APB differ in cells co-expressing STIM1 with Orai2 or Orai3. A, ICRAC recordings from HEK293 cells co-expressing eYFP-Stim1 with Orai2. Stores were actively depleted with IP3 and BAPTA in the pipette. 2-APB (20 and 50 μm) was focally applied through extracellular bath exchange as indicated (black trace). The control recording (gray trace) shows no slow inactivation development in ICRAC recorded from Orai2 + Stim1-expressing cells, as described previously (18, 20). B, current-voltage (I-V) relationship from recording shown in A. In this recording, the initial sweep, used for leak subtraction, showed some residual outward current, likely due to incomplete block of outward K+ current by Cs+. C, similar experiment as in A except in a HEK293 cell co-expressing eYFP-Stim1 with CFP-Orai3. D, I-V relationship from experiment shown in C, showing the biphasic currents that develop in the presence of 50 μm 2-APB. The current was initially inwardly rectifying (i) followed by the development of an outward current (ii) at potentials greater than +50 mV.
FIGURE 6.
FIGURE 6.
Activation of Orai1 and Orai3 by 2-APB does not require STIM1 or store depletion. A–D, Ca2+ imaging experiments showing the effects of 50 μm and then 200 μm 2-APB on cytoplasmic Ca2+ levels in control cells (black) or STIM1 siRNA-treated cells (gray) transfected with Orai1 (A), Orai2 (B), or Orai3 (C). Results similar to those seen in Orai2-expressing cells (D) were also seen in YFP alone expressing control and STIM1 siRNA-treated cells (data not shown). D, peak changes in cytoplasmic Ca2+ detected in control (black) or STIM1 siRNA-treated (gray) HEK293 cells expressing Orai1, Orai2, or Orai3 and treated with 50 μm 2-APB. Under all conditions, the data are the mean ± S.E. of three coverslips, and each coverslip is the mean of at least 25 cells. E, mean of four independent Ca2+ imaging experiments (≥25 cells/experiment) looking at the effects of several concentrations of 2-APB (0–50 μm) on cytoplasmic Ca2+ concentration in cells expressing CFP-Orai3. F, concentration-response curve showing the direct activation of Orai3 by 2-APB. NCF, nominally Ca2+ free.
FIGURE 7.
FIGURE 7.
Influence of endogenous STIM1 and store depletion on the activation of Orai3 by 2-APB. Mean single-cell Ca2+ imaging results in which stores were depleted with 2 μm TG under the presence of nominally free extracellular Ca2+ conditions for 15 min followed by the addition of 2 mm Ca2+ to assess SOCE in WT HEK293 cells (A) or in cells expressing CFP-Orai3 (B). Five minutes after addition of Ca2+, 50 μm 2-APB was applied. C, change in fluorescence ratio seen after 5 min in the presence of 2 mm Ca2+ and 50 μm 2-APB in cells expressing Orai3 alone without ER Ca2+ store depletion (replete; n = 5 coverslips) or after store depletion with 2 μm TG (deplete; n = 3 coverslips (B)). Each n represents the mean of a single coverslip containing at least 25 cells.
FIGURE 8.
FIGURE 8.
2-APB activates Orai1 and Orai3 independently of STIM1 and internal Ca2+ store depletion. A, whole-cell currents recorded from HEK293 cells expressing Orai1, Orai2, or Orai3 before, during, and after focal application of 50 μm 2-APB. Cytoplasmic Ca2+ concentrations were buffered using BAPTA and millimolar concentrations of Ca2+ (calculated using Maxchelator software) in order to avoid passive store depletion. 2 mm extracellular Ca2+ was present throughout these experiments. B, current-voltage relationships from the recordings shown in A. C, bar graph showing the change in current densities (peak 2-APB current minus leak current) recorded from voltage ramps in cells expressing Orai1 (O1), Orai2 (O2), and Orai3 (O3). Data were collected in studies identical to those shown in A (Orai1: n = 4; Orai2: n = 3; Orai3: n = 6). D, comparison of the peak currents recorded in HEK293 cells expressing Orai3 alone (stores replete; n = 6(A)), or Orai3 expressed with STIM1 and stores actively depleted with IP3 and BAPTA in the pipette (Fig. 5; n = 7).
FIGURE 9.
FIGURE 9.
2-APB-activated Orai3 currents have increased Cs+ permeability compared with Orai3-mediated CRAC currents activated by store depletion. A, whole-cell patch clamp recording taken at –100 and +100 mV from a HEK293 cell expressing Orai3. The internal pipette solution contained Ca2+“clamped” to 100 nm Ca2+. Voltage ramps (–100 to + 100 mV) were applied every 2 s from a holding potential of 0 mV. External solutions were applied as indicated by the bars above the recording. NCF, nominally Ca2+-free external solution. B, current-voltage relationships taken from the recoding shown in A, when either 2 mm (black trace) or 20 mm (gray trace) extracellular Ca2+ was present in the bathing solution. C, current-voltage relationships also taken from A, showing that 2 mm Mg2+ present in the nominally Ca2+-free (gray trace) external solution is sufficient to block nearly all Na2+ current through the 2-APB-activated Orai3 channels. Black arrows indicate the time points at which the I-V traces were taken. D, representative recording taken under conditions similar to those in A; however, a cesium-DVF solution was applied after activation of Orai3 with 2-APB. E, current-voltage relationships of the Ca2+ and Cs+ currents seen in these HEK293 cells expressing Orai3 and activated directly with 2-APB. F, representative wholecell recording taken from a HEK293 cell co-expressing Orai3 and STIM1, in which ER Ca2+ stores were actively depleted with 20 μm IP3 and 20 mm BAPTA in the patch pipette. The extracellular bathing solution was switched from a 2 mm Ca2+-containing solution to one lacking all divalent cations and containing either the monovalent cation Na+ (black) or Cs+ (gray) as the charge carrier. Unlike in 2-APB-activated Orai3 recordings, Cs+ does not permeate well through STIM1 and store depletion-activated Orai3 channels. G, current-voltage relationships from the peak Cs+ and Na+ currents seen in the Orai3 + STIM1-expressing HEK293 cells after active ER Ca2+ store depletion. All traces are representatives of at least three similar recordings.

Similar articles

Cited by

References

    1. Putney, J. W. (1986) Cell Calcium 7 1–12 - PubMed
    1. Smyth, J. T., DeHaven, W. I., Jones, B. F., Mercer, J. C., Trebak, M., Vazquez, G., and Putney, J. W. (2006) Biochim. Biophys. Acta 1763 1147–1160 - PubMed
    1. Hoth, M., and Penner, R. (1992) Nature 355 353–355 - PubMed
    1. Parekh, A. B., and Putney, J. W. (2005) Physiol. Rev. 85 757–810 - PubMed
    1. Roos, J., DiGregorio, P. J., Yeromin, A. V., Ohlsen, K., Lioudyno, M., Zhang, S., Safrina, O., Kozak, J. A., Wagner, S. L., Cahalan, M. D., Velicelebi, G., and Stauderman, K. A. (2005) J. Cell Biol. 169 435–445 - PMC - PubMed

Publication types